

Illecilewaet Glacier
© Parks Canada
Studying glacial recession
Glacier National Park

Parks Canada resource conservation staff travelling on the Illecillewaet Glacier.
© Parks Canada / Michel Beauchemin
North America’s First Glaciologists
The study of glacial recession in Glacier National Park was started by the Vaux family over 125 years ago—North America’s first glaciologists! Siblings Mary, George and William Vaux of Philadelphia first travelled here as tourists in 1887. They photographed the Illecillewaet Glacier on their first visit and again on their second visit in 1894. They were struck by how much the glacier had receded in those seven years. For another decade, the Vaux family returned each year to monitor and photograph the glacial recession from a number of fixed locations—the earliest known glacier research in North America. Their photographs and notes continue to be invaluable to the study of glaciology and climate change today.


Repeat Photography
In 2011 and 2022, repeat photography was conducted in partnership with the Mountain Legacy Project to compare glacial changes over time. This repeat photography project compared photos taken in 2011 and again in 2022 to those taken in the past from the exact same location. In addition to photographs the Vaux family took, glass photo plates were also taken by early surveyors working for the railway in the late 1800s. By comparing new images to old ones, we can get a clear picture of glacial recession.

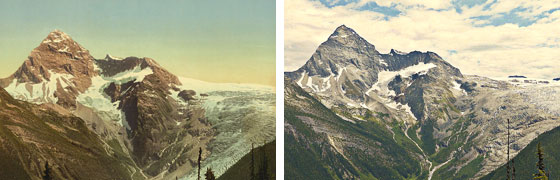
Views of the toe of the Illecillewaet Glacier in 1887 (left) and 2011 (right)
© McCord Museum (left) / Mountain Legacy Project (right)
In the above image, repeat photography compares a view of the toe of the Illecillewaet Glacier in 1887, at left, to the bare rock face after glacier retreat in 2011, at right.
In the image below, taken below Abbott Ridge, significant glacier recession is observed.
Illecillewaet Glacier in 1902 (left) and 2011 (right)
© Detroit Photographic Co. (left) / Mountain Legacy Project (right)
Measuring Glacial Meltwater
In glaciated regions, the freshwater from glacial melt plays an integral role in the ecosystem. Melting glaciers influence water temperature in streams and rivers, and provide short-term water sources to maintain stream flow in the late summer. This is especially true during dry summers characterized by extended droughts.
In 2009, Master’s student Jocelyn Hirose initiated a glacier mass balance research project with support from Parks Canada. This study looked at the net gain or loss of mass of the Illecillewaet glacier in Glacier national park. Part of this project consisted of measuring and modeling glacier runoff during the summer months to determine how much of it was from snow melt and glacier melt.


The study found that over the course of three years, glacier run-off during summers was on average 112,300,000 m3 of water—that’s approximately 44,920 Olympic sized swimming pools! Glacier melt-modelling and water chemistry showed that 34% of the melt water came from glacial ice and 66% from snow.

© Parks Canada / Hirose and Marshall 2013
This indicates that if our glaciers disappeared, water volumes in the creeks and streams of this area could decrease by up to one third. It is likely that water volumes would actually decrease by more than this, because the loss of glaciers would also lead to a loss of snowpack, since glaciers act like refrigerators, helping to preserve the snowpack. The decrease in glacial melt will also result in both an increase in water temperature and lower oxygen levels in the area’s creeks, streams and rivers, affecting our fish, amphibians and invertebrates.
Measuring Surface Glacier Mass Balance

Glacier Mass Balance measures the changes between annual gain through snow accumulation and loss through glacial melt. A negative mass balance means a glacier is losing mass, usually leading to its recession, while a positive mass balance means it is gaining mass, which typically leads to growth of the glacier. Winter and summer mass balances (gain and loss) have been measured annually on the Illecillewaet Glacier since 2009, in spring and fall. The results are regularly reported to Natural Resources Canada who shares them with the World Glacier Monitoring Service (WGMS). The WGMS, with its predecessor organizations, has been compiling and disseminating standardized data on worldwide glacier fluctuations for over a century.


Measuring Glacier Volume
In 2018, ground penetrating radar was used to determine the thickness of the Illecillewaet Glacier. The results obtained could eventually be used in the development of a 3-D model of the glacier to help predict its future based on current and predicted climate.

Counting glaciers
An inventory of the alpine glaciers and icefields found in Mount Revelstoke and Glacier national parks was completed in 2011. Overall, the area covered by glaciers in Glacier National Park decreased by 74.28 km2 from 202.46km2 between 1978 and 2011. The annual rate of loss appears to be higher since 2006 for both parks, suggesting continuing warming may be offsetting expected weather trends A new glacier surface area survey is scheduled for both parks in 2023. Its results will be compared to the ones obtained by the 2011 survey.

References
- Hirose J.M.R. and S.J. Marshall (2013). Glacier Meltwater Contributions and Glaciometeorological Regime of the Illecillewaet River Basin, British Columbia, Canada, Atmosphere-Ocean, 51:4, 416-435, DOI: 10.1080/07055900.2013.791614
- Menounos B., A. Bevington, B. Pelto, C. Tennant and R. Wheate (2018). University of Northern British Columbia. Final Report for State of the Parks Report on Glaciers. Glacier and Jasper National Parks. Parks Canada Contract: RC17-3444.
- Pelto B.M., F. Maussion, B. Menounos, V. Radic and M. Zeuner (2020). Bias corrected estimates of glacier thickness in the Columbia River Basin, Canada. Journal of Glaciology 1–13. https://doi.org/10.1017/jog.2020.75
- Wheate R. and N. Alexander (2013). Glacier Inventory Update Project. Glacier and Mount Revelstoke national parks. Technical Report, May 2013. Revised Version: September 2013. Parks Canada Contract 13-0117.
Related links
- Date modified :