
- Evaluation of National Historic Site Visitor Experience (PDF, 1.4 Mb)
Office of Internal Audit and Evaluation
Report submitted to the Parks Canada Performance Measurement and Evaluation Committee: September 25, 2019
Approved by the Agency President & CEO: January 14, 2020
Her Majesty the Queen in Right of Canada, represented by the Chief Executive Officer of Parks Canada, 2020
Catalogue No.: R62-564/2020E-PDF
ISBN: 978-0-660-33769-2
Table of contents
- Executive summary
- 1. Introduction
- 2. Description of the National Historic Site Visitor Experience Sub-Program
- 3. Evaluation design
- 4. Evaluation findings
- 5. Conclusions, recommendations and management response
- Appendix A: Strategic outcome and program alignment architecture
- Appendix B: Evaluation matrix and source definitions
- Appendix C: List of sites visited, by province/territory
- Appendix D: Levels of service for National Historic Sites
- Appendix E: Application of the visitor experience framework at National Historic Sites
- Appendix F. Parks Canada audience segments
- Appendix G: Data collection instruments and data limitations
Executive summary
Parks Canada's National Historic Sites Visitor Experience Sub-program involves a range of activities, services and products associated with the design and delivery of visitor experiences at national historic sites owned and administered by the Agency. Over the period of evaluation, this sub-program accounted on average for an estimated 8% of the Agency's total annual expenditures. It is linked to Parks Canada's mandate to protect and present nationally significant examples of Canada's cultural heritage.
Evaluation purpose and design
The sub-program was selected for evaluation as part of the Agency's commitment under the Treasury Board Policy on Evaluation (2009)Footnote 1 to evaluate all direct program spending over a five-year period. This sub-program was last evaluated as part of the Evaluation of Parks Canada's Visitor Service Offer (2012).
The evaluation covers the period from fiscal year 2010-11 to 2016-17. Some activities and results that occur outside this period are also considered where relevant. As significant time has elapsed since the conduct of this evaluation, it should be noted that changes or updates to the program that may have occurred after the abovementioned timeframe are not reflected in the present report.
The evaluation examined the relevance and performance (effectiveness and efficiency) of the sub-program, consistent with the requirements of the Treasury Board Policy on Evaluation (2009). This approach is also consistent with the new Treasury Board Policy on Results introduced in 2016.
Evaluation findings
Relevance
Overall, the National Historic Site Visitor Experience Sub-program is relevant and consistent with the priorities, roles and responsibilities of both the Parks Canada Agency and the Government of Canada. The sub-program directly supports the Agency's mandate and vision by fostering opportunities for visitors to discover, experience, enjoy and develop a sense of personal connection to Parks Canada-administered national historic sites. The visitor experience is the primary means by which Parks Canada shares heritage messages in support of the commemorative integrity of these sites. It is through these learnings that Canadians have a better understanding of role and the significance of these sites in forming our shared history.
Performance
At a system-level, the Agency has met most of the expected results for the sub-program as identified in the Agency's Performance Management Framework. In 2016–17, Parks Canada welcomed more than five million visitors to its national historic sites, the largest recorded level of visitation since 2010-11. This increased visitation was well above the national target of 2%. Though not perfectly correlated with visitation, revenues at national historic sites are also increasing. The Agency is also meeting and/or exceeding its targets for visitor satisfaction, enjoyment, and learning. However, there may be a need to improve results related to visitor connection at national historic sites.
Parks Canada's On Target Strategy (2011) identified the need to diversify and renew opportunities to attract and grow target audience segments.Footnote 2 The strategy further specified a set of core and optional activities aligned with targeted audiences to be used in support of this renewal. The evaluation examined the extent to which this direction has contributed to the achievement of corporate results against the six activity areas of Parks Canada's national visitor experience framework. The following summarizes key findings related to each activity:
- Identify target audiences: In recognition of the need to broaden the visitor base to include more non-traditional audiences, Parks Canada has identified and refined national target audiences.
- Do a diagnostic: Parks Canada has completed national reviews of the national historic site visitor experience in attempts to develop an integrated strategy to address key barriers to visitation. While most national historic sites have access to site-level data that could be used in conducting a local diagnostic, the majority of existing Visitor Experience Assessments pre-date the new direction introduced by the Agency in its On Target Strategy (2011). Since 2012, there have been few comprehensive diagnostics completed.
- Create and deliver visitor experiences: Parks Canada has used its management flexibilities to implement significant changes to the design and delivery of the sub-program at numerous national historic sites (e.g., move to a 'self-guided' delivery model, reductions in hours and season of operations). Our evaluation identified numerous examples of renewal of the visitor experience offer at national historic sites, including both the implementation of new national programs aimed at increasing visitation from target audiences and site-specific initiatives. However, many sites have a limited capacity to develop, deliver and review new programs, products and events.
- Promote: For people to choose a protected heritage place as their destination, Parks Canada also needs to inform potential visitors about the opportunities available at sites and entice them to plan their experience. The Agency has made strides in improving its website and broadening its exposure on social media platforms. However, staff are challenged to develop effective site-level campaigns given limited marketing resources. Many sites now leverage partners' resources to increase their reach, either through joint marketing efforts or partnered events.
- Measure and report: Parks Canada has implemented performance measurement programs to ensure the accountability and effectiveness of the sub-program; data collected is used to inform performance against the sub-program's corporate indicators. However, there is an unmet demand for more timely information focused on specific activities and programs at the local level and some confusion on when and how field level staff may collect additional information.
Under the Directive on Results, program management should develop and monitor valid and reliable information concerning the efficiency of its programs. However, as the period under evaluation pre-dates the Directive, expectations related to efficiency were limited to the tracking of financial and human resources assigned to this sub-program. This descriptive information was reviewed to note trends in the data, including the fact that spending increases can largely be attributed to increases in investment-related assets. This is largely the result of significant funding the Agency received under the Federal Infrastructure Investment Program to improve the condition of its entire built asset portfolio.Footnote 3 Moving forward with the implementation of the Directive on Results, developing and implementing efficiency measures at both the program and site levels represent significant future challenges for the Agency and will likely require a coordinated effort by management, financial and performance/evaluation specialists over time.
The situation is similar with respect to judging the relative performance of individual national historic sites, as information for judging performance is not uniformly available at all sites and, when it is available, different metrics may provide different perspectives on site performance. Interpreting this variability and drawing conclusions about performance at the site level needs to take into account the operating circumstances of each place.
Recommendations
Recommendation 1
The Vice-President, External Relations and Visitor Experience, and Senior Vice-President, Operations, should develop a consistent approach to classifying national historic sites according to their level of visitor offer and identifying which sites must apply the visitor experience framework.
Recommendation 2
The Vice-President, External Relations and Visitor Experience, should develop a communications strategy to ensure a clear and consistent presentation of target audiences and how these are to be used in decision-making.
Recommendation 3
The Vice-President, Indigenous Affairs and Cultural Heritage, in consultation with the Vice-President, External Relations and Visitor Experience, should review and update the performance measurement indicators related to visitor learning and understanding at national historic sites.
Global management response
The data contained in this report was collected between 2010-11 and 2016-17; since the conduct of the evaluation, important changes have taken place which impact the program.Footnote 4 In particular, Parks Canada has updated its On Target Strategy, which outlines key audiences and markets the Agency is targeting in the coming years. The primary audience focus for On Target 2019-2022 continues to be on families with young children, young adults, and on representing the increasing diversity of Canadian society. The primary domestic markets are the greater Toronto, Montreal and Vancouver metropolitan areas, while the secondary domestic markets are the greater Calgary, Edmonton, Ottawa-Gatineau, Winnipeg and Halifax metropolitan areas. Priority international markets are from Germany, the United Kingdom, France, the United States, Australia and China.
To ensure the success of the On Target Strategy and to ensure that field units have the most up-to-date information available to them, the External Relations and Visitor Experience Directorate provides support related to target markets to the field units through Visitor Experience Strategy Planning and Marketing and Promotion support. This information is supported through Parks Canada's intranet site and community calls.
1. Introduction
This report presents the results of the Evaluation of Parks Canada's National Historic Site Visitor Experience Sub-Program. This sub-program was selected for evaluation as part of the Agency's commitment under the Treasury Board Policy on Evaluation (2009) to evaluate all direct program spending over a five-year period. This sub-program was last evaluated as part of the Evaluation of Parks Canada's Visitor Service Offer (2012).
2. Description of the National Historic Site Visitor Experience Sub-Program
National Historic Sites of Canada are places that have been designated by the Minister responsible for Parks Canada, on the advice of the Historic Sites and Monuments Board of Canada (HSMBC), in recognition of their direct association with a nationally significant aspect of Canadian history. These sites illustrate technological achievements, cultural traditions or ideas important to the development of Canada and/or that are explicitly and meaningfully associated with persons or events of national historic significance. They are located in all provinces and territories and can be found in almost any setting, from urban areas to remote wilderness environments, and can range in size from a single structure or archaeological site to a large-scale heritage complex.
Canada's system of national historic sites includes 971 designated places. Parks Canada owns and/or administers 171 of these. Management of the visitor experience at this sub-set of national historic sites is the primary focus of the sub-program. The program includes a range of activities, services and products associated with pre-visit planning, the on-site visit, and post-visit communications. It is also responsible for ensuring that the reasons for a site's designation as a national historic site are effectively communicated to the public.
2.1 Expected results and targets
Parks Canada's Mandate
"On behalf of the people of Canada, we protect and present nationally significant examples of Canada's natural and cultural heritage, and foster public understanding, appreciation and enjoyment in ways that ensure their ecological and commemorative integrity for present and future generations."
Expected results for Parks Canada's National Historic Sites Visitor Experience Sub-program reflect the Agency's mandate to protect and present nationally significant examples of Canada's cultural heritage.
Performance expectations related to the sub-program are found at all levels of the Agency's Performance Management Framework. Expected results and performance indicators for the 2016-17 fiscal year are presented in Table 1. These relate to sub-program's outputs (i.e., condition of assets), reach (i.e., number of visits), and outcomes (i.e., visitor satisfaction, enjoyment, connection and learning).
| Level of outcome | Expected result | Performance indicator |
|---|---|---|
| Strategic outcome | Canadians have a strong sense of connection, through meaningful experiences, to their […] national historic sites […] and these protected places are enjoyed in ways that leave them unimpaired for present and future generations. | |
| Visitor Experience (Program) | Canadians and international visitors visit Parks Canada's administered places and feel a sense of connection to these places. | Increase in the number of visits at Parks Canada-administered places. Target: 2% (annually). |
| Average percentage of visitors that consider the place is meaningful to them. Target: 85% (annually). | ||
| Average percentage of visitors that are satisfied with their visit. Target: 90% (annually). | ||
| National Historic Site Visitor Experience (Sub-Program) |
Visitors at surveyed national historic sites enjoyed their visit. | Average percentage of visitors that enjoyed their visit. Target: 90% (annually). |
| Visitors at surveyed locations learned from experience and active participation. | Average percentage of visitors that consider that they learned about the cultural heritage of the national historic site. Target: 85% (annually). | |
| Condition of visitor experience assets in poor or very poor condition is improved to fair or good.Footnote 5 | Percentage of assets assessed to be in poor or very poor condition is improved to fair or good. Target: 100% by March 2020. | |
While not identified in the Agency's Performance Management Framework, increasing revenue is another ongoing corporate priority for Parks Canada. For the period under evaluation until 2015, Field Unit Superintendents' mandate letters state a target for revenue increases within each field unit of 2.5% (annually). Revenues generated by the visitor experience at national historic sites contribute to this objective.
Since 2011, these targeted results have been driven by Parks Canada's On Target Strategy (2011),Footnote 6 designed to align efforts in visitor experience to Parks Canada's long-term objectives to expand and diversify its visitor base. The exception is targeted results for asset condition, related to the Federal Infrastructure Investment Program introduced in 2015.
Commemorative Integrity
Commemorative Integrity The condition or state of a national historic site when it has retained the heritage value for which it was designated. This is the desired state for a national historic site.
Sharing the historic significance of national historic sites and the heritage value of the cultural resources they contain is an essential element of effective cultural resource management. Effective communication of the reasons for designation as a national historic site is one of the three pillars of commemorative integrity. In 2013, the Agency introduced a revised Cultural Resource Management Policy that outlines the requirements for the management of cultural resources at Parks Canada, including specific direction for national historic sites. Expected results for the sub-program are also aligned to the objective and expected results of this policy, i.e., to ensure that cultural resources administered by Parks Canada are conserved and their heritage value is shared for the understanding, appreciation and enjoyment of present and future generations.
2.2 Activities and outputs
Parks Canada has developed a broad framework to support the planning and delivery of the Visitor Experience Program. Most elements of this framework (i.e., policies, directives, guidelines and tools) have been designed by the External Relations and Visitor Experience Directorate to be applied across all of Parks Canada's major heritage systems, including but not limited to national historic sites. Given the diversity of the Agency's parks and sites, while requirements exist to enable or restrict specific activities, there is also flexibility within this framework to facilitate its practical use in the development and delivery of the local offer.
Activities under this broad visitor experience management framework can be split into six categories, following the basic order of the visitor experience planning and delivery cycle; (1) identify target audiences; (2) do a diagnostic; (3) create the offer; (4) promote; (5) deliver on-site experience; and (6) measure and report. This is an iterative cycle; not all stages will be completed in a specified order or as a separate activity.
Details on the Agency's performance on delivering each of these activities and outputs is discussed in section 4.2.
2.3 Resources (inputs)
2.3.1. Budget and expenditures
Parks Canada began reporting on expenditures at the sub-program level in 2012-13. The National Historic Site Visitor Experience Sub-program is funded through both general appropriations (A-base) and special purpose funds. From 2012-13 to 2015-16, average annual expenditures on the sub-program were reported to be about $61 million. This amounts to about 20% of the Agency's total spending on visitor experience or 8% of total expenditures for the Agency.
More details on budgets and expenditures are presented in section 4.3.4.
2.3.2. Human resources
Parks Canada began reporting on human resources at the sub-program level in 2012-13. On average, the Agency reports about 600 Full-Time Equivalents (FTEs) dedicated to the sub-program from 2012-13 to 2015-16. However, the actual human resource allocation decreased by about 31% over this same period.
Many of Parks Canada's national historic sites also rely on local community groups, volunteers and/or contracted third parties to deliver all or part of the visitor experience offer. For the purpose of this evaluation, these external human resources are considered to be an input for sub-program delivery.
Details on the efficiency of the human resource structure are presented in section 4.3.4.
2.4 Roles and responsibilities
Since April 2016, the Senior Vice-President, Operations, led the delivery for the sub-program at the operational level.Footnote 7 This position is supported by six Executive Directors; each has multiple reporting Field Unit Superintendents. These Field Unit Superintendents and their teams are accountable for meeting expected results associated with the visitor experience program within their assigned field unit. Each field unit contains up to sixteen national historic sites.
The Vice-President, External Relations and Visitor Experience, provides functional guidance for the National Historic Site Visitor Experience Sub-program. There are seven branches under this Directorate that provide direction, guidance and support to field units in order to help them meet their performance expectations for the sub-program.
At the field level, the actual composition of responsible staff differs according to the organizational models defined by the Agency, which are driven by a number of factors, among which are the operational requirements of the field unit and the availability of resources. Most field units also have one or more designated National Historic Site Manager(s) and/or National Historic Site Visitor Experience Manager(s), who may each be responsible for one or more national historic sites. They are supported in planning and delivering the visitor experience offer by a variety of staff responsible for a wide range of activities, including product development, promotions, interpretation, and site maintenance.
The Vice President, Indigenous Affairs and Cultural Heritage, also plays a key role in the visitor experience at national historic sites given their responsibility as functional lead for the management of cultural resources. In particular, Parks Canada historians play a significant role in the development of visitor experience programming as important advisors on the delivery of public history at national historic sites. However, the Cultural Resource Management Policy (2013) gives express accountability to the Vice-President, External Relations and Visitor Experience, for ensuring that the requirements of the policy are applied to visitor experience activities and programs at Parks Canada's national historic sites and for monitoring and reporting on policy requirements related to the visitor experience in these places, in particular the sharing of heritage value at national historic sites.
2.5 Reach
The visitor experience at national historic sites is intended to benefit the understanding, appreciation and enjoyment of all Canadians, both present and future. From 2010 to 2016, Parks Canada-administered national historic sites recorded an average of 4.6 million visitors per year.
Parks Canada also works with a variety of partners and stakeholders in the delivery of the sub-program. These include Indigenous partners, sponsored third party businesses, tourism and business associations, non-profit organizations (e.g., "friends of" associations), volunteers and other government departments and agencies at all levels of government.
2.6 Logic model
A logic model showing the relationships between inputs (i.e., human resources and expenditures), activities and outputs, reach, and intermediate and long-term outcomes is shown in Table 2. This logic model was developed for the purposes of the evaluation. However, its language and structure have been aligned to the extent possible with the logic model contained in the draft Performance Information Profile for the Visitor Experience Program under the Treasury Board Policy on Results.
| Strategic Outcome: Canadians have a strong sense of connection, through meaningful experiences, to their national parks, national historic sites and national marine conservation areas and these protected places are enjoyed in ways that leave them unimpaired for present and future generations. | |||||||
|---|---|---|---|---|---|---|---|
| Inputs |
|
||||||
| PCA Activities |
|
Visitor Services | |||||
|
|
|
|
|
|
||
| PCA Outputs |
|
|
|
|
|
|
|
| Reach |
|
||||||
| Immediate Outcomes |
|
||||||
| Long-Term Outcomes |
|
||||||
3. Evaluation design
3.1 Evaluation purpose and scope
This evaluation focuses on the National Historic Sites Visitor Experience Sub-program of Parks Canada's Program Alignment ArchitectureFootnote 8 (see Appendix A). The evaluation examined the relevance and performance (i.e., effectiveness, efficiency,) of the sub-program, consistent with the requirements of the Treasury Board Policy on Results introduced in 2016.
This evaluation generally covers the period from fiscal year 2010-11 to 2016-17. Some activities and results that occur outside this period are also considered where relevant. The scope of the evaluation includes the management of the framework for the visitor experience program defined as the six elements outlined in section 2.2. The focus of the evaluation was on the specific application of the framework within the context of Parks Canada-administered national historic sites.
There are 171 national historic sites owned or administered by Parks Canada. The primary focus of the evaluation was on national historic sites with a stand-alone visitor experience offer provided by Parks Canada (an estimated 70 sites). The nature and extent of the visitor experience delivered by Parks Canada at these sites varies significantly.
The scope of the evaluation excludes the Agency's nine heritage waterways and four associated national historic sites (i.e., Fort Ste-Thérèse, Peterborough Lift Lock, Mnjikaning Fish Weirs, and the Merrickville Blockhouse) as coverage of these elements was planned as part of a broader future evaluation of heritage canal management. The scope of the evaluation also excludes activities, outputs and outcomes related to:
- Visitor safety, which will be covered as a separate evaluation.
- Agency-wide promotion initiatives, considered to be part of the Heritage Places Promotion and Public Program.
The evaluation was completed concurrent with an Evaluation of the National Historic Site Conservation Sub-program (2019). Where relevant, progress on management actions resulting from the Evaluation of Parks Canada's Visitor Service Offer (2012) were also considered as part of this evaluation.
3.2 Evaluation approach and methodology
A detailed matrix of evaluation questions, performance expectations, indicators and relevant data sources is found in Appendix B. Parks Canada evaluation staff conducted the evaluation's field work between September 2015 and June 2017. The findings presented in the evaluation are based on the following five data collection methodologies: document review, database analysis, key informant interviews, field visits and comparative analysis. These definitions as well as the strengths, limitations and mitigation strategies of the evaluation are explained in Appendix B.
4. Evaluation findings
4.1 Relevance
With respect to relevance, the evaluation examined the National Historic Site Visitor Experience Sub-Program's relevance to the needs of Canadians, alignment to the priorities of the Government of Canada and Parks Canada, and alignment with the Agency's legislative and policy mandate.
The Parks Canada Vision
Canada's treasured natural and historic places will be a living legacy, connecting hearts and minds to a stronger, deeper understanding of the very essence of Canada.
Overall, the evaluation found that there is a continued need for the sub-program. The sub-program directly supports the Agency's mandate and vision by fostering opportunities for visitors to discover, experience, enjoy and develop a sense of personal connection to Parks Canada-administered national historic sites. Research has shown that visiting and experiencing national historic sites increases the likelihood that visitors will value, appreciate and feel more connected to these places.
To support the commemorative integrity of national historic sites, the Agency's Cultural Resource Management Policy (2013) also requires the sharing of heritage values at these places, including for the site as a whole and related to specific cultural resources that they contain. The visitor experience is the primary means by which Parks Canada shares heritage messages in support of the commemorative integrity of these sites. It is through these learnings that Canadians have a better understanding of the role and the significance of these sites in forming our shared history.
Additionally, the sub-program was found to be relevant given:
- Canadian support for visitor experiences at national historic sites is widespread. The National Survey of Canadians (2014) found very strong public support for visitor experiences at national historic sites and that this support is reflected in visitation, with 75% of Canadians (aged 18+) reporting having visited a Parks Canada-administered site at least once during their lifetime. This is also demonstrated at the local level, where many national historic sites are woven into the fabric of local communities (e.g., as places of community gathering, to enjoy special events, etc.).
- The sub-program is responsive to needs of visitors. The Agency is responding to an increasingly urbanized and ethnically diverse Canadian population by actively working to maintain and increase the relevance of its national historic site visitor offer, reviewing and updating its visitor offer with innovative, demand-driven programming intended to resonate with both traditional and new audiences.Footnote 9 This shift towards a more visitor-oriented approach to sharing heritage messages was also integrated into revisions to the Agency's Cultural Resource Management Policy (2013).
- The sub-program aligns with Government of Canada priorities. The National Historic Sites Visitor Experience sub-program is consistent with priorities in the federal government's Whole of Government Framework (i.e., high-level outcome areas defined for the government as a whole). This sub-program is principally tied with the outcome area of "A vibrant Canadian Culture and Heritage." The program is also aligned with the outcome area of "Strong Economic Growth." National historic sites are significant local economic drivers, especially in remote locations where the site may be the anchor of the tourism offer. A study of the Economic Impact of Parks Canada (2011) estimated that national historic sites provided an annual contribution of over $440 million to the Canadian economy. Of this total, visitor spending accounted for 41% of Gross Domestic Product impacts, 45% of employment impacts and 30% of tax impactsFootnote 10.
- The sub-program is aligned with Parks Canada priorities. The National Historic Site Visitor Experience sub-program also contributes to other ongoing corporate priorities (e.g., increases in visitation and revenue) as well as those that are time-limited, with national historic sites playing an important role in hosting events marking the celebration of various key events in the history of Canada (e.g., the 150th anniversary of Confederation and the 100th anniversary of National Historic Sites of Canada, both in 2017).
- The sub-program is aligned with Parks Canada's legislative and policy mandate. The preamble to the Parks Canada Agency Act (1998) and the Canada National Park Act (2000)Footnote 11 both reference the presentation, use and enjoyment of Parks Canada-administered places by Canadians. While "visitor experience" is not a term used in legislation, the Parks Canada Agency Act foresees that there will be visitor "use" of Parks Canada's properties and quality "services" provided to the public. The Agency's Guiding Principles and Operational Policies (1994) further outline the important roles of visitor experience programming in the commemoration, protection and presentation of natural and cultural heritage. In general, Parks Canada's policies have been designed such that the visitor experience at national historic sites can support this broader objective by allowing for visitor use while maintaining both ecological and commemorative integrity.
4.2 Performance: activities and outputs
The evaluation examined the performance of the six key activities in the visitor experience framework: (1) identify target audiences; (2) do a diagnostic; (3) create the offer; (4) promote; (5) deliver on-site experience; and (6) measure and report. A precursor to this analysis was to determine where Parks Canada expects this visitor framework to be applied. The nature and extent of the visitor offer is not mandated in legislation or policy. Rather, the nature of the offer at specific national historic sites is generally dictated by Agency priority and availability of resources, as well as public demand for the offer and logistical considerations (e.g., roads to access site). The evaluation's design recognizes that the visitor experience at these sites varies significantly.
The number of national historic sites with a visitor experience offer could be defined more clearly.
Parks Canada uses various systems to define and classify the visitor offer at its national historic sites. However, while the systems overlap, they do not completely align. For example, draft Guidelines for Heritage Presentation at Non-Operational Sites (2004) define "non-operational" national historic sites as those administered by Parks Canada at which there are no regular on-site staff (no permanent or seasonal presence).Footnote 12 These guidelines further indicate that Parks Canada sites at which heritage communications are presented by third-party operators are considered to be operational sites. However, while some sites presented by third-party operators do have a significant visitor offer (e.g., Fort Henry National Historic Site), it was unclear whether these external operators adhere to the Agency's visitor experience framework.
The Agency's National Pricing Standards (2015) offers another definition based on level of service. As per these standards, 60 of the 155 (39%) national historic sites included in the scope of the evaluation are identified as having some level of visitor service offer (see Appendix D). The remaining 95 sites (61%) are classified as Level 1, defined as "having no basic heritage presentation or visitor services." However, in practice, the criteria used to define the level of service does not effectively capture diversity and quality of product offer. For example, some Level 1 sites (e.g., Dawson Historic Complex) have an extensive offer.
Other potential proxy indicators of a service offer include the recording of expenditures related to an offer, the collection of attendance data (i.e., person visits and/or paid visits), and/or the conduct of visitor surveys. The number of reporting units with the various types of indicators is shown in Table 3.
| Indicator | Number of reporting units (2016-17) a |
|---|---|
| Expenditures b | 95 |
| Person-visitsFootnote 13 | 76 |
| Paid visitsFootnote 14 | 53 |
| Visitor Information Program (Survey) | 73 |
| National Pricing Standard (Level 2 to 5) | 60 |
| Notes: a – Each reporting unit may include one or more national historic sites. b – Total based on locations where expenditures have been recorded against relevant financial codes. c – Total number of reporting units refers only to sites that use Point of Sale data (i.e., excludes sites using other revenue collection methods). |
|
For the purposes of this evaluation, this data was used to develop a working definition of where the visitor experience framework should be applied for the sub-program. This includes all national historic sites included in the Attendance Program (assumed to be operational) with a stand-alone visitor service offer implemented by Parks Canada, in whole or in part. This definition excludes sites in this category that are operated fully by third parties (n=3)Footnote 15 and those within a national park for which the site lacks a significant stand-alone offer (n=3).Footnote 16 In total, 70 national historic sites were expected to have applied the Agency's framework (refer to Appendix E for a list of these sites).
This issue is addressed by Recommendation 1.
4.2.1. Identify target audiences
Audience segmentation and identification of targets audiences are considered the key initial steps for the Agency to properly position its offer and effectively renew, diversify and promote related visitor experience opportunities. Target audiences were expected to have been identified, both for the system as a whole and to guide the actions of specific national historic sites.
The Agency identified and refined national target audiences.
In 2011, Parks Canada's On Target Strategy identified the need to define the Agency's national audiences based on current visitation and broader marketplace data. Building on earlier analyses, this strategy introduced the national target audiences for the Agency. These audiences include both current visitors (i.e., those to "retain and grow") and those audiences predicted to have the best long-term potential for the Agency (i.e., those to "nurture and grow"). Special consideration was given to building relevance with new Canadians, young families and young adults.
Parks Canada invested in two related tools to further define these audiences:
- Explorer Quotient: Developed by the Canadian Tourism Commission (now Destination Canada) in collaboration with Environics, Explorer Quotient is a tool designed to understand visitors based on their social values and travel preferences.
- PRIZM: A proprietary, market-based segmentation software tool, PRIZM uses demographics, behaviours, and psychographics to profile Canadians. Licensed for internal use by Parks Canada since 2010, the tool permits understanding of audiences, their needs and interests, ways to reach them, what is important to them, and where they are located.
The Agency's application of these tools involved segmenting potential visitors into three broad life stages (i.e., younger, family and mature years), each of which is further divided into two or more sub-groups, with a few additional customized segments identified (i.e., divisions within a specific sub-group). Definitions of these segments are presented in Appendix F. Additional details on audience segmentation are provided in Appendix G.
Table 4 shows the target segments identified over the course of the period under evaluation to either retain or nurture. These segments have evolved over time, reflecting changes in the underlying population (e.g., changes in size, location, values and habits of specific segments). Such evolution is normal and to be expected in audience segmentation.
| 2011 | 2013 | 2015 | |
|---|---|---|---|
| Retain and grow |
|
|
|
| Nurture and grow |
|
|
|
The On Target Strategy (2011) gave general direction for all of the Agency's parks and sites to align their target audiences with national priority segments. Until 2015, Field Unit Superintendents' mandate letters had also committed them to develop or adjust some revenue generation activities for visitors from the Agency's target audiences. This direction does not mean that sites should neglect their existing key audiences if they do not fall into one of these segments but rather is designed to ensure that consideration is given to developing audience potential over the long-term.
Over the period under evaluation, the External Relations and Visitor Experience Directorate developed and communicated guidance and tools supporting the application of the Agency's target audience approach. However, while visitor experience staff at national historic sites were aware of Parks Canada's national target audiences, many could not readily identify the specific audiences being targeted at their site. To some extent, this gap can be attributed to inconsistencies in the presentation of target audience segments in different reference materials. For example, the Directorate's program of on-site product development and promotion workshops (2013 to 2016) communicated a focus narrowed to four key target audiences.Footnote 17 These four audience segments also continue to be identified as part of the Agency's focused outreach and marketing efforts. While it is reasonable for the Agency to narrow its focus to meet the needs of specific initiatives, related messaging and the continued availability of outdated materials has contributed to confusion with regards to the application of the target audience framework.
This issue is addressed by Recommendation 2.
4.2.2. Do a diagnostic
Diagnostics draw from existing data about current visitation to conduct an internal assessment of the visitor experience in order to understand the strengths and weaknesses, threats and opportunities within the existing visitor experience offer of one or more national historic sites. Diagnostics may also assess the internal capacity and skill sets of staff in order to identify training gaps or partnering and volunteer resources that may be required in order to enhance the visitor offer. In principle, these assessments are a key component of the visitor experience planning process, helping sites ensure alignment in the delivery of appropriate experiences for current and future visitors.
Parks Canada completed national-level diagnostics of the national historic site visitor experience.
In response to years of decreasing visitation, Parks Canada started working to review and renew its visitor experience offer at national historic sites as early as 2004. For example, a review of the Marketing of National Historic Sites of Canada Program (2004 to 2009) and the integrated strategy for the National Historic Site Renewal Initiative (2009) both examined the changes required to increase the relevance of Parks Canada-administered national historic sites. Parks Canada research conducted since 2009 identified some key barriers to visitation.Footnote 18 These barriers included: a low level of awareness of national historic sites and what they offer; the public's general perception that national historic sites are boring and that their exhibits are dull and outdated; and the relatively remote location of some national historic sites and the attendant challenges of drawing visitors to these sites as stand-alone destinations.
With the celebration of the centennial of Canada in 2017, Parks Canada developed strategies to address barriers identified and attract new visitors, including: influencing visitation by promoting lesser known or less visited historic sites located in proximity to urban centres; encouraging sites that offer interpretation to develop special events to celebrate the centenary; and developing itineraries that integrate national historic sites into broader travel programs that attract more varied audiences.
Site-level diagnostics completed for national historic sites could be improved or updated.
Visitor Experience Assessment
A diagnostic tool used to assess the current state of factors that influence visitor experience opportunities at a park, site, or marine area.
The On Target Strategy (2011) explicitly identified the completion of a Visitor Experience Assessment as one of four "core" activities required to effectively identify a site's specific target audience segments. While the External Relations and Visitor Experience Directorate continues to provide guidance and templates that can be used to complete diagnostics, it no longer prescribes the approach to be used or frequency of assessment.
Over the period under evaluation:
- Most national historic sites had access to site-level data that could be used in conducting a diagnostic. This includes data collected by Parks Canada through its Attendance Program and survey-based Visitor Information Program (see Appendix G). Since 2013, the External Relations and Visitor Experience Directorate has also used information derived from the RMS Point-of-Sale System to provide sites with Operational Analytic Reports and Market Analysis Reports. While not officially considered as tools to be used in completing diagnostics, these reports provide a succinct summary of paid visits, revenues, target audiences, and other demographic data such as party size and composition, visitor origin, visit frequency, visit duration, and service language. In total, 76% (n=53) of the national historic sites included in our analysis had received one or more analytics report since 2013. Most of the sites that have not received a report either lack sufficient transactions to complete such analyses and/or do not collect revenue through the Agency's RMS Point-of-Sale System.
- Visitor Experience Assessments were the most utilized diagnostic tool over the evaluation period but the results are now outdated. Of the 70 national historic sites included in our analysis, 83% (58) completed one or more Visitor Experience Assessment from 2008 to 2011. However, recommendations included in these assessments pre-date the significant new direction provided in the On Target Strategy (2011), and there is no evidence to suggest that any comprehensive Visitor Experience Assessments have been completed since 2011.
Lack of capacity was identified as a key barrier impacting these results. In 2013, direct support from the External Relations and Visitor Experience Directorate to assist in completing diagnostics was discontinued in the majority of locations. National historic sites with short operating seasons, where human resources are limited to a small number of seasonal staff, noted that they have since been particularly challenged to complete a diagnostic. Except for three sites, where reviews were completed as part of planning for major re-investment initiatives (Green Gables Heritage Place, Fisgard Lighthouse NHS and Rocky Mountain House NHS), available evidence suggests that most recent diagnostics were limited to desktop reviews specific to a few programs.
The lack of a concerted, cohesive approach to completing diagnostics and resulting audience and product development strategies has been identified as an issue in the Agency. Parks Canada has responded with the recent introduction of a supply arrangement to support the development of site-specific Visitor Experience Strategies. While it is too soon to comment on its effectiveness, the design of this instrument addresses some of the issues identified by this evaluation: it unites approaches from the Agency's existing toolkit under a single umbrella for greater efficiency and integrity; adds new tools based on needs identified through consultation with the field; and can be scaled to sites of any size or complexity. This approach to conducting a diagnostic also includes multiple perspectives on potential audiences.
4.2.3. Create and deliver visitor experience offer
The visitor's on-site experience at a national historic site is the result of a number of elements, including ease of navigation to and circulation within the site, visitor reception and orientation, and the facilities, services, programs and interpretation that are available to support their enjoyment and learning. The nature of delivery of these experiences varies with the scale and complexity of offer at a particular site. In all cases the Agency maintains Quality Visitor Experience Standards, including a Parks Canada Guarantee, to ensure that visitors are satisfied.
The On Target Strategy (2011) identified the need to diversify and renew opportunities to attract and grow target audience segments as one of three key visitor experience strategies. The strategy further specified a set of core and optional activities aligned with targeted audiences to be used in support of this renewal. National historic sites were expected to have followed this direction.
While creation of the visitor offer and its delivery are separate activities in the visitor experience management framework, they are presented together in our analysis as their effective implementation is enabled or impeded by similar factors.
Over the period of evaluation, it was found that:
- Renewal of Parks Canada's Cultural Resource Management Policy (2013) added flexibility for visitor experiences. Revisions to this policy enable national historic sites to offer stories and experiences not related to the national historic significance of the site. Overall, interviewees perceived this to be a positive change.
- National historic sites have made progress towards renewal of the visitor experience offer. The evaluation identified many examples of renewal of the visitor experience offer at national historic sites. This includes both the implementation of new Agency-wide or system-specific national programs aimed at increasing visitation from target audiences and site-specific initiatives and special events (e.g., Fort George NHS has hosted rock concerts, an ice skating rink, and an annual Canadian Steampunk Exposition). Programs that have experienced the greatest participation are shown in Table 5. The Agency's current inventory of new programs and products reflects a similar trend observed at benchmark heritage sites in Canada, the United States and internationally.
- A working inventory of visitor experience programs was not maintained over the period. As a result, the extent of renewal efforts cannot be quantified. In 2016, the Visitor Experience Branch prepared a comprehensive inventory of activities, programs and products that could serve as a baseline for future comparisons of the evolution of the offer over time.
| Program | Participation by National Historic Sites | Description of program | |
|---|---|---|---|
| No. | % | ||
| Xplorers | 58 | 83% | An activity program for young children. |
| Red Chairs Experience | 56 | 80% | Encourages visitors to seek out the "red chairs" to enjoy scenic locations and to share their experience through social media. |
| Explora | 24 | 34% | Makes use of handheld computers and Global Positioning System technology to deliver location-specific content to trail users. |
| Hands on History | 18 | 26% | Programs provide opportunities for visitors to dress in period costumes and have first-hand experiences with the history of a national historic site (e.g., soldier for a day). |
| Culinary Experiences | 12 | 17% | Programs provide opportunities for visitors to experience culinary products or events such as picnics, historical meals, traditional cooking workshops, and drink tastings. |
| White Glove Tours | 7 | 10% | Provides opportunities for visitors to handle and learn about original historic objects and artifacts. |
Source: Parks Canada Website and information provided by the External Relations and Visitor Experience Directorate.
In 2011, Parks Canada also committed to increase Indigenous programming at sites by: (i) refining interpretive messages and creating opportunities for the public to learn about Indigenous peoples; and (ii) ensuring that every park and site, where relevant, will present Indigenous themes over the next five years. This commitment was reinforced in 2015, with the Final Report of the Truth and Reconciliation Commission. This included a Call to Action to "develop a reconciliation framework for Canadian heritage and commemoration" (No 79). In 2016, Parks Canada received $4.7 million over five years, to encourage Indigenous story-telling and tourism opportunities across all of Parks Canada's places. Indigenous programming (e.g., interpretive programs, exhibits and special events) was found to be in place at numerous national historic sites. However, at the time of the evaluation, an inventory of sites with Indigenous programming developed in 2011 had not been kept up-to-date. As a result, the evaluation cannot conclude on the extent to which Parks Canada's commitments have been met.
Management flexibilities and constraints impact the creation and delivery of visitor experience.
In 2012, Parks Canada responded to direction for government-wide reductions in departmental spending by implementing significant changes to the design and delivery of the National Historic Sites Visitor Experience Sub-Program. These changes reflected management flexibilities highlighted by the Evaluation of the Visitor Service Offer (2012) as factors that could contribute to the economic and efficient operation of the sub-program (e.g., decisions related to the nature and scope of the offer that is delivered at a particular location, structure and duration of the operating season and the hours of operation, composition of the work force, etc.). Specific changes included reductions in the operating season and hours at numerous sites, and reduced in-person interpretation at 32 national historic sites moved to a 'self-guided' delivery model – i.e., where Parks Canada would not directly deliver any personal interpretation included with admission. These changes were expected to result in Agency-wide savings of $2 million per year.
The evaluation found that the results of these changes on the renewal and delivery of the visitor experience have been mixed. For example, field units successfully used available flexibilities to determine the nature of new 'self-guided' experiences appropriate to a specific site's context. Sites that continue to require on-site personnel to mitigate risks to visitor safety and/or resource condition have introduced enhanced pay-for programming or shifted to third party delivery. By contrast, while a few sites have successfully made a business case to extend their operating season,Footnote 19 field staff generally perceived the restricted season would result in missed opportunities to align to the local audiences that are more important in spring and fall (e.g., school groups, cruise tours).
Connected to these cost-saving measures were commensurate changes to staffing, including staff reductions and an increased use of seasonal staff. The current evaluation found that these changes compounded some existing capacity challenges in the ongoing design and delivery of the visitor service offer that are common across the system of national historic sites. These include:
- Lack of capacity to develop and review new programs or products. Field staff noted that they often have ideas for new programs or products but lack the time and personnel to put them in place. The increase in the seasonal nature of staffing at numerous sites also leaves a limited window to review the performance of new initiatives.
- Limitations in capacity to deliver new programs and special events. Given limited staff, time spent on delivery of new programs or special events draws staff away from more traditional interactions with visitors. Ensuring sufficient capacity for evening and weekend programming presents particular administrative challenges (e.g., organization of schedules to ensure an adequate visitor service while also minimizing staff over-time or burn-out).
- Challenges in delivery of consistent messages. Reductions in operating season have also impacted on the ability to train and retain staff, with resulting challenges in delivering consistent messages for interpretation as new staff hired each year may lack a detailed knowledge of the site.
Management has developed some national mechanisms to assist in the development and implementation of specific products and programs. For example, there is a long-standing Historic Weapons Advisory Committee which brings together subject-matter specialists from across the Agency to advise the Executive Management Committee on programming involving the use of historic weapon systems. The committee also provides national training and certification to Historic Weapons Supervisors and Demonstrators, and contributes to the evaluation and review of related policy and programming. This group has been instrumental in developing new programs now delivered at many of the Agency's historic forts (e.g., Soldier for a Day).
There is also information on the internet that provide guidance and tools for implementing the Learn-to Camp program at the local level and a newer intranet site designed to support implementation of various kinds of culinary experiences at national historic sites.Footnote 20 These tools were viewed as good practice. We noted a desire among staff in the field for more of these planning tools (e.g., for White Glove Tours) and for other types of activities and programs. An exhaustive inventory of all potential programs or activities that would benefit from this kind of guidance was not compiled for the purposes of this evaluation.
4.2.3.1 Assessing impacts of activities and interventions to cultural resources
Parks Canada's Guiding Principle on Appropriate Visitor Activities (1994) are clear that public demand alone is not sufficient justification for provision of facilities and services. The Cultural Resource Management Policy (2013) specifies that all interventions (including revisions to the visitor offer) that may adversely impact the cultural resources of a national historic site need to be assessed before implementation to predict and mitigate their impact on the site's commemorative integrity. While the level of effort and detail of the assessment should be scaled to the potential severity and complexity of likely impacts, in all cases the results must be documented to record the considerations and rationale for the decision, and any mitigation and monitoring of mitigation actions.
Parks Canada's Management Bulletin on Recreational Activity and Event Assessments (2010) outlines a process and set of principles to be used to assess new or existing activities and events that present significant opportunities and/or areas of concern in Parks Canada's protected heritage places. This Bulletin presents two scales of assessment: national and local. To date, five such assessments have been completed related to activities that may occur in national historic sites (i.e., national assessments of geocaching, community gardens, Learn-to Camp, mobile food vendors, and a local assessment for a kitchen shelter in Fort Langley National Historic Site). These assessments include considerations of, and proposed mitigations for, the impact of the visitor experience on cultural resources.
Since 2012-13, important decreases and restructuring of human resources supporting the Agency's conservation of national historic sites have reduced field units' access to expert support for decision-making related to cultural resource management.Footnote 21 While field staff indicated that relevant experts within the Agency were consulted prior to the introduction of new activities and events not covered by an approved Recreational Activity and Event Assessment (e.g., White Glove Tours, major concerts), no documented records of any site-specific assessments were provided. As a result, it is difficult to confirm the extent to which these assessments took place or to assess their quality. Sharing activity-specific assessments among sites that may be considering similar revisions to their visitor offer could also increase the efficiency and effectiveness of this activity.
In 2015, the Agency also introduced a new Cultural Resource Impact Analysis (CRIA) process to support requirements of the Cultural Resource Management Policy. According to Parks Canada's updated Project Management Standard (2016), all major infrastructure projects that may impact a cultural resource now required a CRIA to be completed during the planning phase. While it is still too soon to comment on the effectiveness of this process, it is expected to increase the level of rigour surrounding approvals.
4.2.3.2 National Historic Site visitor experience assets
National historic sites contain two broad categories of assets, i.e., cultural resources related to the historic designation of the site and contemporary assets. Contemporary assets play an important role in the delivery of the on-site experience by providing:
- Access to and within the sites (e.g., roads, parking areas, trails);
- Visitor reception and services (e.g., visitor reception centres and kiosks, washrooms, potable water and wastewater systems, day use and picnic areas, accommodations); and
- Interpretation (e.g., historic reconstructions, interpretive panels and exhibits). Some national historic sites with an extensive visitor offer are composed largely of contemporary assets (i.e., reconstructions of historic buildings) intended to assist in interpreting the history of the site.Footnote 22
Cultural resources such as heritage buildings and engineering works not only have historic significance but also form the basis for presentation and interpretation at national historic sites. These cultural resources must also be managed in a way that maintains the commemorative integrity of the national historic site. This creates logistical issues for the visitor experience. For example, respect for the cultural landscape or in-situ archaeological sites may impact where parking or washrooms are located, how visitors access the sites, or the location of kiosks to collect fees resulting in a less than optimal situation for the visitor experience. By the nature of national historic sites, physical accessibility is also an issue at a large number of sites that has a direct impact on an important demographic of visitors (i.e., seniors). These challenges will require more creativity to resolve. Solutions that may be appropriate for contemporary infrastructure (e.g., to add an elevator) may negatively impact on the heritage value of cultural resources.
Studies completed by external benchmark organizations indicated that a lack of appropriate maintenance of heritage buildings and engineering works decreased user satisfaction with historic places. Findings related to the inventory and condition of these cultural resources is reported in the Evaluation of National Historic Site Conservation (2019).
Inventory and Condition of Contemporary Assets
We expected that Parks Canada would know the inventory and condition of its visitor experience assets in national historic sites. Since 2009, Parks Canada has undertaken significant work to improve the knowledge of the built assets it administers. In 2012, the Agency completed a National Asset Review to verify basic information about its built asset portfolio (i.e., number of assets, overall asset condition, and estimates of current replacement value and deferred work). This review estimated the current replacement value of the Agency's entire portfolio to be in the range of $15 billion to $16.6 billion, and the backlog of deferred work to be between $2.6 billion and $2.8 billion.Footnote 23 Within this portfolio, 679 national historic site-related visitor experience assets were estimated to have a current replacement value of $455 million and a backlog of deferred work of almost $90 million.Footnote 24
In 2015, Parks Canada began migration from its existing asset management system software to a new asset database, Maximo. An estimated 90% of data validation and migration was completed by September 2016. According to the data in Maximo, 917 assets located within the Agency's national historic sites were coded to 'Visitor Experience,' with a current replacement value (CRV) estimated at $690 million (excluding assets at historic canals). Table 6 compares the profile of the visitor experience assets from the National Asset Review in 2012 to data in Maximo from 2016.
| Year | AssetsFootnote 25 | Overall condition profile | Grand total | Value of deferred work ($K) | |||||
|---|---|---|---|---|---|---|---|---|---|
| 'A' (Good) |
'B' (Fair) |
'C' (Poor) |
'D' (Very Poor) |
C+D | N/A | ||||
| 2012 | Total | 226 | 250 | 154 | 32 | 186 | 17 | 679 | 89,970 |
| % | 33% | 37% | 23% | 5% | 28% | 3% | |||
| 2016 | Total | 552 | 55 | 104 | 206 | 310 | 0 | 917 | 134,089 |
| % | 60% | 6% | 11% | 22% | 33% | 0% | |||
| Total change | ↑326 (142%) |
↓195 (-78%) |
↓50 (-32%) |
↑174 (544%) |
↑106 (67%) |
↓17 (-100%) |
↑238 (35%) |
↑44,119 (49%) |
|
Source: National Asset Review (2012); Maximo (2016).
Context is critical to understanding the change in this data from 2012 to 2016. The number of assets attributed to the sub-program increased by 35% between 2012 and 2016, reflecting a re-coding of existing assets and new acquisitions. Changes in the condition profile of assets reflect both updated condition ratings (e.g., integrating results of more recent condition inspections) and condition improvements resulting from actual asset investments. The evaluation lacks the data to determine the extent to which changes in condition can be attributed to each of these factors.
Targets related to the condition of visitor experience assets were introduced in 2015-16. The related expectation – i.e., that 100% of assets assessed to be in poor or very poor condition are improved to fair or good by March 2020 – was a response to significant funding the Agency received under the Federal Infrastructure Investment Program to improve the condition of its entire built asset portfolio. Parks Canada is expected to make measurable progress in this area.
During the period under evaluation, the data showed that:
- Performance against this target is reported to be 'on track.' In 2016-17, the Agency reported that 25% of asset improvements had been completed by March 2017 (i.e., 53 of 209 assets). This included notable infrastructure improvements made in at least 30 national historic sites. This performance is measured against the sub-set of assets identified as being in poor or very poor condition by the National Asset Review (2012).
- Plans are in place to address deferred work. As of January 2017, the Parks Canada's major project tracking database indicated that 70 projects targeting visitor experience assets were either planned or underway in 37 national historic sites, with a total project value estimated at $71 million.Footnote 26 This is in addition to infrastructure work now in progress to address deferred work on cultural resources located at the sites.
- Visitor experience assets outside the scope of infrastructure investments also require attention. For example, an Agency-wide wayfinding signage renewal initiative was to be completed by 2010. We observed that this signage for many sites is still either absent or outdated (e.g., lacking current Parks Canada brand), affecting ease of navigation. Interpretive panels at numerous sites are also weathered, vandalized or missing, with a potential impact on visitor learning.
The current level of deferred work is the result of years of underinvestment in maintenance and recapitalization. In 2014, an independent review recommended an annual recapitalization maintenance of 4.8% of current replacement value to ensure the sustainability of the Agency's entire asset portfolio. Parks Canada's current A-base budget for asset investments is well below this level. While it is expected that the Federal Infrastructure Investment Program should reduce deferred work, it has a limited temporal scope and budget. It is only expected to address about half the value of deferred work currently estimated for visitor experience assets at national historic sites (estimated at $134 million in 2016). Parks Canada continues to work to develop solutions to ensure long-term asset sustainability.
4.2.4. Promote
For people to choose a protected heritage place as their destination, Parks Canada also needs to inform potential visitors about the opportunities available at sites and entice them to plan their experience. The evaluation expected Parks Canada to effectively plan for and be engaged in promotion and cross-promotion of its renewed visitor offer to target audiences.
During the period under evaluation, it was found that most national historic sites lacked a site-specific marketing plan or promotion strategy. Of the sites visited, only six national historic sites and two field units provided evidence of a marketing plan or promotion strategy for national historic sites that could be used to guide sites in determining how to best communicate their visitor offer. Target audiences were sometimes identified in these documents but the related marketing strategies were not always clear and often only nominally reference PRIZM segmentation. There was no reference to the Explorer Quotient in any of these marketing documents.
Most national historic sites are not stand-alone tourism destinations. As a result, staff stressed the importance of aligning their limited marketing resources to those of the larger provincial or regional tourism audience; these audiences may not be the same as those targeted by the Agency. By field unit, these marketing resources range from about $15,000 to $50,000 per year. While materials produced generally conform to the Design Standards for the Promotion of Parks Canada's Places and Products (2014), data in the annual report on Parks Canada's paid advertising forecast suggests only 15% of national historic sites' paid advertising activities were strategically aligned with Parks Canada's target audiences. The majority (70%) of paid advertisements were included in national, provincial and/or regional tourism guides targeted at the general travel consumer. Similar results were noted in 2015-16.
Recognizing these limitations:
- At the site level, national historic sites are working with partners to increase their reach. For example, 'Symphony Under the Sky' was conducted in partnership between Motherwell Homestead National Historic Site and the Regina Symphony Orchestra. This event was promoted on both the Symphony's and on Regina Tourism's websites. The site also partnered with a local brew pub who brewed a Motherwell Homestead commemorative beer that was unveiled at the event. Parks Canada leveraged these partners' resources to promote the event and site to a broader audience than would have been possible given the internal limitations related to paid advertising.
- At an Agency-wide level, Parks Canada is now making increased use of its own national and regional guides to promote and cross-promote its protected heritage areas. Recent guides also include suggested local itineraries intended to draw visitors towards lesser known or more remote locations. While specific national historic sites are also often engaged in on-site cross-promotion for other Parks Canada places, there are likely opportunities to increase use of on-site cross-promotion of these local itineraries.
Parks Canada has been challenged to maintain current and relevant trip planning tools.
To encourage visitation, Parks Canada also needs to provide potential visitors with dynamic, current and relevant information that will enable them to plan their experience. The evaluation expected Parks Canada to have made effective trip planning tools available to visitors. Parks Canada's key trip planning tools include:
- Parks Canada's website. This is currently the planning tool most used by potential visitors. Over the evaluation period, total usage grew from 7 million to over 20 million unique website visits per year. An estimated 20% of these unique page visits were for national historic sites.
- National Information Service. This national call centre is used by Parks Canada to respond to public inquiries on behalf of the Agency (over 96,000 each year).
- Social Media. Parks Canada is increasingly expanding into social media platforms including Facebook, X (Twitter) and more recently Instagram. These are being actively used by national historic sites as a promotional and engagement tool.
In 2011, Parks Canada recognized that its current trip planning products did not reflect visitor needs, trends and corporate direction. A Trip Planning Working Group formed to address the issue recommended improvements in web content as a priority focus. Building off an earlier web renewal project, Parks Canada's website was upgraded and aligned with the new Canada.ca web format in April 2017. Related improvements have addressed some of the issues identified by the working group.
Ensuring that information provided to visitors for each national historic site (e.g., hours of operation, programs and products offered) is current and relevant is the responsibility of field units. The evaluation found that this has also been a challenge, with potential impacts on effective trip planning. For example, call centre agents rely on Parks Canada's website and an 'Agent Wizard' information tool to respond to public inquiries. The Agent Wizard contains site-specific information details provided by field staff that are not easily found on-line.Footnote 27 While intended to ensure regional expertise in agents' advice, this assumes that periodic updates are completed. While some national historic sites had voluntarily completed periodic updates, approximately five years had elapsed between requests for Agency-wide updates of this information (2011-12 to 2016-17).
More recently, the Agency (i.e., beginning in May 2017) made a number of improvements to its trip planning tools including updating its website, and launching a Mobile App focused on trip planning. Updated information was conveyed to the National Call Centre, and a Google search engine strategy that updated information available on Google for trip planning at 200 Parks Canada locations was also developed.
4.2.5. Measure and report
To ensure accountability for the sub-program and assess the effectiveness of activities, the evaluation expected: the Agency to have implemented relevant and reliable performance measurement programs; that data collected be recorded in appropriate systems; and that procedures be in place to ensure its integrity. Further, it was expected that this information be used to review, report on and improve program performance.
Documents showed that Parks Canada has relevant performance measurement programs in place for the Visitor Experience Program, including but not limited to national historic sites. Data used to inform performance against the sub-program's corporate indicators are primarily collected through three key instruments – the Attendance Program, the Visitor Information Program, and the Point-of-Sale System. Descriptions of these instruments and their related data limitations are found in Appendix G.
The data collected via these instruments is recorded in appropriate systems and combined to inform site-specific market analytics. As discussed in section 4.2.2, Operational Analytic and Market Analysis Reports have been available to illustrate operational data related to the site-specific visitor experience at most national historic sites since at least 2013.Footnote 28 Not surprisingly, data in the reports drawn from different sources can sometimes provide inconsistent information.Footnote 29 While the reports do refer the reader to some of these data limitations, the onus is on the site staff to interpret the data appropriately.
Field staff reported a desire for additional and current visitor information.
Field staff agreed that the information presented in market analytic reports, while useful for strategic analyses, had limited use in directing day-to-day management decisions related to the visitor experience of a site. The reports are not designed to provide information on specific elements of the offer that are working or not working, or how these can be adjusted for improved results. While target audience segments that are under-represented at a site are identified, the reports provide no information on why these people are not visiting sites. They do not help managers in the field understand what motivates or drives a visitor to visit a site.
Similarly, visitor surveys, conducted every five to ten years, provide periodic information on outcomes but are too infrequent to provide information for short- or medium-term decision-making. National historic sites subject to a core visitor survey can and have used customized questions to gather information on elements of the site-specific program offer, but in some cases there have been an insufficient number of respondents to these questions to provide useful results.Footnote 30
In the absence of this information, field staff rely on sources such as direct observation, verbal feedback provided by visitors on-site, and generic comment cards to obtain immediate feedback. They may also refer to comments generated in external online review sites such as TripAdvisor.
Since 2012, the Agency has directed its employees that public opinion research would only be undertaken for responding to government accountability requirements (i.e., for periodic National Surveys of Canadians and for the Visitor Information Program surveys of visitors). In a few cases, however, field staff have been encouraged to evaluate the success of local programs or activities using short surveys. For example, the Learn-to Camp Handbook encourages sites to evaluate a local event both in order to share success stories and to improve future events, using a template developed for the national Learn-to Camp Program. Similarly, material for developing and delivering various kinds of culinary experiences indicated that evaluation is a key step in judging the success of the experiment, and staff were encouraged to provide participants with a short survey. Interviews revealed that field staff were seeking clarity with respect to visitor feedback and in which situations local management was free to assess and evaluate local programming.
Several of the benchmark organizations interviewed (e.g., Ontario Parks and Sépaq) reported using online surveys to obtain more timely information from visitors.Footnote 31 Canadian Heritage has also recently used a mix of on-site intercept surveys and online follow-up questionnaires to assess satisfaction with some major events in the National Capital Region (e.g., Winterlude, Canada Day). While these approaches can provide more real-time information to management, they are subject to their own methodological limitations, such as response rates and representative sampling.
4.3 Performance: system-level outcomes and efficiency
The evaluation examined Parks Canada's performance against the expected results of the National Historic Site Visitor Experience Sub-program at two levels: (1) the national historic sites system as a whole; and (2) related to the performance of individual national historic sites. This section presents evaluation findings related to the sub-program's reach (i.e., number and demographic profile of visitors), outcomes (i.e., visitor satisfaction, enjoyment, connection and learning), and efficiency as well as for the system as a whole. Findings related to the performance of individual national historic sites are found in section 4.4.
The performance analysis is limited to where outcomes are measured by the Agency, and as such the specific n-count varies by outcome. While some corporate targets for the visitor experience are national in scope (i.e., are measured as a factor of results achieved across all systems), data specific to national historic sites was examined to determine the extent to which trends for this system agreed with or diverged from national trends.
4.3.1. Reach: person-visits, paid visits and target audiences
Since 2009-10, Parks Canada has had an ongoing expectation to maintain or increase visitation across all its heritage places. The current target is to increase the number of visits at Parks Canada-administered places by 2% per year. While there is no specific target for the sub-program, it was found that the trend within the national historic sites system has matched the national trend towards an overall increase in person-visits since 2010-11 (Figure 1). Attendance results for 2016-17 show the highest national historic site visitation levels recorded since the target was introduced, at close to 5.4 million person-visits.
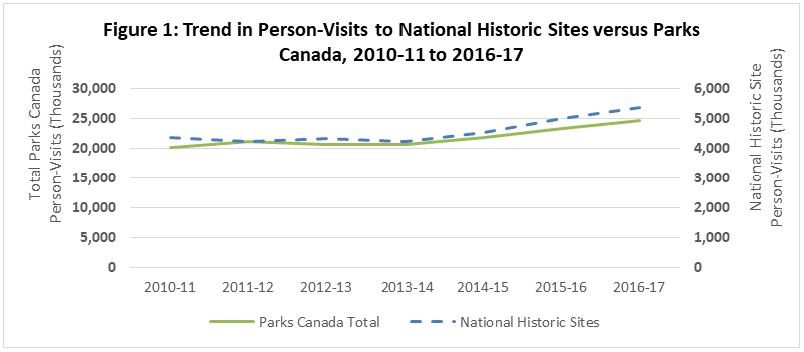
Source: Parks Canada Attendance Reports, 2010-11 to 2016-17
Text Version
| 2010-2011 | 2011-2012 | 2012-2013 | 2013-2014 | 2014-2015 | 2015-2016 | 2016-17 | |
|---|---|---|---|---|---|---|---|
| Person-Visits: | |||||||
| Parks Canada Total | 20,211,000 | 21,100,000 | 29,645,000 | 20,698,000 | 21,776,000 | 23,322,000 | 24,737,000 |
| National Historic Sites | 4,357,000 | 4,220,000 | 4,346,000 | 4,218,000 | 4,547,000 | 4,985,000 | 5,366,000 |
While large special events (e.g., concerts and celebrations) had a demonstrated impact on increasing visitation at specific sites, it is otherwise a challenge to attribute changes in visitation to Parks Canada's national historic sites directly to the Agency's actions given the significant impact of external factors such as economic trends and world events. A statistical analysis conducted by Parks Canada's Social Science Branch attributed 97% of the variance in the Agency's overall visitation across all parks and sites to four factorsFootnote 32:
- The value of the Canadian dollar, which influences decisions regarding outbound trips;
- The national unemployment rate, which influences the number of Canadians with the economic potential to go on vacation;
- Large disruptive events (e.g., international travel advisories); and
- Changes in attendance methodology.
The study concluded that the best situation for Parks Canada is a low unemployment rate and a low Canadian dollar. In the absence of such favourable economic conditions, the Agency may be more challenged to maintain its recent momentum.
Paid visits and revenues are increasing
In 2014-15, Field Unit Superintendents have been directed through mandate letters to increase revenue by increasing both paid visitation and revenue per visitor. In 2015-16, mandate letters stated a target for revenue increases of 2.5% (annually). We expected the national historic sites system to be contributing to progress towards these objectives.
Table 7 presents data on the trend in paid visits and revenue over the four-year period for which it is available from the Point-of-Sale System (2013-14 to 2016-17). There are 46 national historic sites that have consistently used this system since 2013-14. Based on the data from these sites, paid visits increased 38% to just over a million while revenues increased 30% to $7.3 million in 2016-17. Entry fees account for about 87% of revenues collected. Given this, it is not surprising that the ten sites with the highest visitation are also the ones that generate the most revenue (accounting for about 71% of all revenues from national historic sites). Other key sources of revenue at national historic sites include heritage programming (7%), merchandise (2%) and rentals (2%).
| Metric | 2013-14 | 2014-15 | 2015-16 | 2016-17 | Percentage Change 2013-14 to 2015-16 |
|---|---|---|---|---|---|
| Paid Visits | 858,916 | 897,535 | 1,032,825 | 1,187,188 | 38% |
| Total Revenues | $5,635,323 | $5,648,976 | $6,582,895 | $7,311,702 | 30% |
Source: Point of Sale System Data
Under Parks Canada's User Fees and Revenue Management Policy (2016), service fee revenues are to be retained in the parks and sites where they are collected and used to fund visitor services and facilities. In theory, this provides an incentive for all national historic sites to find innovative ways to increase their local revenue.
According to Visitor Information Program survey results, more than 90% of visitors are satisfied with the value for entry fee at the vast majority of national historic sites. While the Agency does not have specific data regarding visitor satisfaction with fees related to new programs and products, Parks Canada is generally perceived to be under-valuing the offer. Restrictions imposed by the User Fees Act (2004) and past government decisions mean that fees at the vast majority of national historic sites were not adjusted over the period under evaluation, either to reflect inflation or significant changes in the visitor service offer. We found that Parks Canada's entry fees and those associated with specific products and services are not necessarily aligned with market rates for benchmark tourism products. Data collected during site visits suggests that while use of sites as venues for special events and rentals is increasing visitation, pricing is often too low to generate net revenue (i.e., there is low financial return-on investment).
Provisions in the new Service Fees Act (June 2017) will facilitate the adjustment of fees to align with the consumer price index. The Act also includes provisions that give the Agency more flexibility to add new fees related to new programs and products. Moving forward, Parks Canada will need to develop internal guidance to direct the application of these new flexibilities.
No evidence to date of sustained shifts in attendance by target audiences
The identification of target audiences in the On Target Strategy (2011) represents a major shift in Parks Canada's approach to the visitor experience. There were no related performance expectations during the period under evaluation. However, moving forward commitments to increase the number of "new Canadians" and "young adults" visiting Parks Canada's places have been included in the Agency's Departmental Results Framework (2017).Footnote 33
Over the period of evaluation, adult-only travel groups (most of whom are mature travellers of 55 years and above) accounted for about 75% of all national historic site travel parties. The family audience represented just 25%.Footnote 34 Numerous national historic sites currently have a largely local or regional audience draw (i.e., the origin of the majority of visitors is within 200 km of the site). Given this, opportunities to increase the proportion of visitors from the Agency's target audiences will be limited to some extent by the local representation of these audiences. However, many national historic sites are also geographically well-positioned to draw from certain target audiences; at least 36 national historic sites are within 50 kilometers of a census metropolitan area, including several sites in the centre of major urban areas.
There are two sources of relevant information regarding the Agency's draw from target audiences: the National Survey of Canadians and data collected by the Point-of-Sale System.
Over the period of evaluation, the Agency conducted two National Surveys of Canadians (i.e., in 2012 and 2014). Participation rates for the portion of visitors from the broad target groups of "new Canadians" and "young adults" are shown in Figure 2. Results refer to participation (i.e., visitation) rates for a three-year period up to and including the year the survey was conducted.
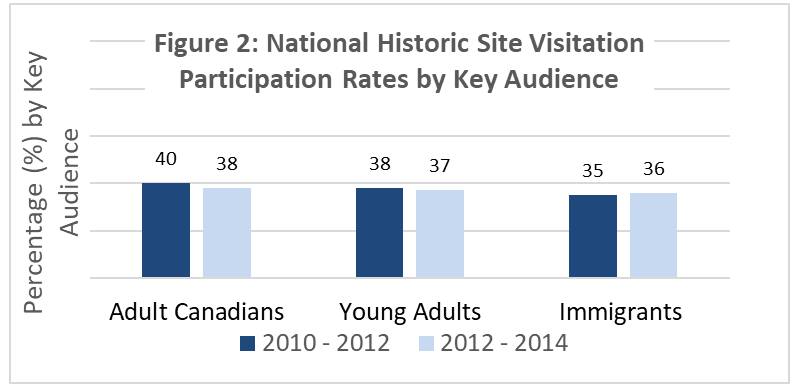
Source: Parks Canada National Survey of Canadians, 2012 and 2014.Footnote 35
Text Version
| Adult Canadians | Young Canadians | Immigrants | |
|---|---|---|---|
| % | % | % | |
| 2010 to 2012 | 40 | 38 | 35 |
| 2012 to 2014 | 38 | 37 | 36 |
Early results show that there was no statistically significant change in the number of young adults (aged 18-29 years) visiting Parks Canada's national historic sites from 2012 to 2014, though these results are based on a limited amount of data at the beginning of the implementation of the strategy.Footnote 36 Visitation from immigrants (defined in the survey as those who immigrated to Canada after 1999) also showed no statistically significant change over this period. Visitation by these demographic groups is reflective of their overall representation in the Canadian population, i.e., the percentage of the Canadian adult population comprised of young adults and immigrants are both roughly the same as the share of visits accounted for by these demographic segments. While these groups do account for a slightly lower share of those Canadians who reported having "ever visited" national historic sites, this is not an unexpected result given their age or limited time living in Canada.
More recently, data collected by the Point-of-Sale System has enabled the Agency to develop a profile of its existing visitor base using audience segments. Data for the four key target audiences was reviewed that have been the focus of the Agency's outreach and marketing efforts (i.e., 'Fledgling Family,' 'Middle Age Achievers,' 'Single Scene' and 'Young Metro'). For many sites outside of Quebec, the combined draw from these four audience segments at any given site currently ranges from about 20% to 39% of paid visitors.Footnote 37
While the Agency is also able to use this data to compare the portion of target audiences at specific sites on a year-by-year basis, data is only available since 2013-14. This is not a sufficient time period to document sustained changes in the composition of visitors to specific sites or to the system as a whole.
4.3.2. Outcomes: visitor satisfaction and enjoyment
In total, 41 national historic sites were subject to a Visitor Information Program survey from 2010 to 2016. These sites encompass approximately 76% of all person-visits to national historic sites over the period. Resulting data indicates that national historic sites are consistently exceeding targets for visitor satisfaction and enjoyment. On average, the percentage of visitors that were both satisfied with and enjoyed their visit has exceeded 90% since the indicators were adopted in 2001.
4.3.3. Outcomes: visitor learning and connection
Besides visitor enjoyment, Parks Canada is directed as part of its mandate to provide opportunities for Canadians to understand and appreciate the significance of national historic sites. On average, the Agency expects at least 85% of visitors at surveyed locations to have learned about the cultural heritage of the national historic site from experience and active participation. It was found that national historic sites are consistently exceeding this target (Figure 3).
The Agency also expects visitors to feel a sense of connection to the places it administers, targeting to have at least 85% of visitors consider the place meaningful to them. While this target is not system-specific, Figure 3 shows this measure of visitor connection is not being consistently met at national historic sites. While many sites do meet or exceed the target, the average at any given site has been as low as 65%. This includes sites that have recently made significant investments to renew their visitor experience. For example, in 2014, the connection result achieved by Cave and Basin National Historic Site following a major renewal investment was still just 67%. This suggests the need for corrective action but Visitor Information Program surveys lack data to explain what influences the outcome or how low connection results can be improved.
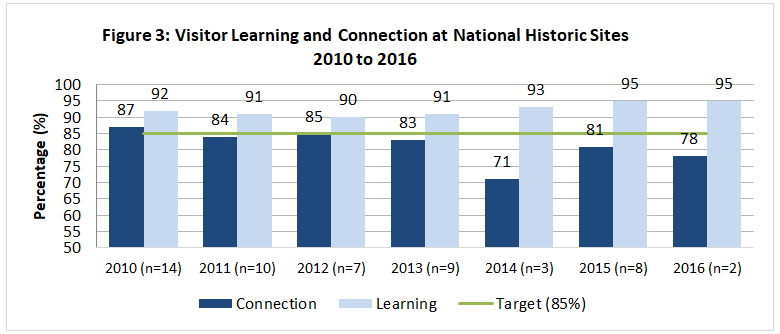
Source: Visitor Information Program, National Summary Reports, 2010 to 2016
Text Version
| 2010 | 2011 | 2012 | 2013 | 2014 | 2015 | 2016 | |
|---|---|---|---|---|---|---|---|
| (n=14) | (n=10) | (n=7) | (n=9) | (n=3) | (n=8) | (n=2) | |
| Indicator: | % | % | % | % | % | % | % |
| Connection | 87 | 84 | 85 | 83 | 71 | 81 | 78 |
| Learning | 92 | 91 | 90 | 91 | 93 | 95 | 95 |
| Target | 85 | 85 | 85 | 85 | 85 | 85 | 85 |
Sharing of heritage value is not effectively measured in assessments of commemorative integrity
The Agency's Cultural Resource Management Policy (2013) considers the effective communication of the reasons for designation of a national historic site to be an essential element of cultural resource management. Given this, the policy requires Parks Canada to share the heritage value of national historic sites at relevant sites as part of its visitor experience.
The Agency periodically assesses the commemorative integrity of its national historic sites. Prior to 2013, these assessments included an analysis of the effectiveness of communications at each relevant site based on a detailed review of the site's communication program (e.g., personal and non-personal interpretation). Of the national historic sites assessed from 2007 to 2012 (n=75), 58% identified the need for minor or significant improvements to the communication of messages in support of commemorative integrity.Footnote 38 While these analyses would also consider audience understanding as measured by visitor surveys (where available), most sites that identified a need for significant improvements based this assessment on gaps identified in the presentation of messages.Footnote 39
Since 2013, measures of performance in this area are derived exclusively from the results of visitor surveys. Visitors are asked to self-assess the extent to which they (i) learned something about the cultural heritage of the place; and (ii) understand the contribution of the place to the history of Canada. This change was a response to both revisions to the Cultural Resource Management Policy (2013) and a decision to streamline the commemorative integrity assessment process. However, the effectiveness of this approach is also impacted by decisions to streamline the Visitor Information Program. Since 2013, only 29 national historic sites are subject to the VIP Core survey. This means that an element of commemorative integrity will not be assessed for about 60% of the 73 sites that are now required to complete a commemorative integrity assessment.
While visitor self-assessment of learning is important to understanding performance, it does not provide any information on how these sites are applying the requirements of the Cultural Resource Management Policy (2013) to share the heritage value of cultural resources with integrity, clarity, and balance. No widespread issues were noted during site visits, but field staff did perceive some issues with interpretation. For example, they noted that there is no evidence that visitation driven by special events (e.g., concerts) enhances visitor learning or connection outcomes. Consistent with direction in the Final Report of the Truth and Reconciliation Commission (Call to Action No. 79), some sites also identified the need to enhance Indigenous programming.
This issue is addressed by Recommendation 3.
Efficiency
Under the Policy on Results, efficiency is defined as the extent to which resources are used such that a greater level of output or outcome is produced with the same level of input or, a lower level of input is used to produce the same level of output or outcome. Under the Directive on Results, program officials are expected to collect valid, reliable, and useful performance data for assessing the efficiency of programs.
In the absence of a clear definition of what constituted an efficient visitor service offer at national historic sites or evidence that efficiency was being assessed and monitored, the analysis in the following section focuses on basic trends in resource utilization over the period of the evaluation (i.e., program expenditures and FTEs). Some of the fundamental challenges that exist with respect to the Agency developing an approach to measuring and monitoring the efficiency of its operations are also noted.
Fluctuations in sub-program expenditures align with significant asset investments.
Parks Canada began reporting on expenditures at the sub-program level in 2012-13. Since this time, the reported total annual expenditures for the sub-program averaged about $61 million. These expenditures accounted for about 20% of the Agency's total expenditures on visitor experience (PA4). Expenditures on visitor experience at national historic sites can be further divided between those linked to specific national historic sites (or groups of sites) and those incurred at either National Office or a Field Unit as a whole. Since 2012-13, data in the Agency's financial system suggests that spending at the site-level has accounted for an annual average of about 65% of total sub-program expenditures. Further details of expenditures coded directly to one or more national historic sites for the period 2010-11 to 2015-16 are shown in Figure 4. Available data suggests that over this period:
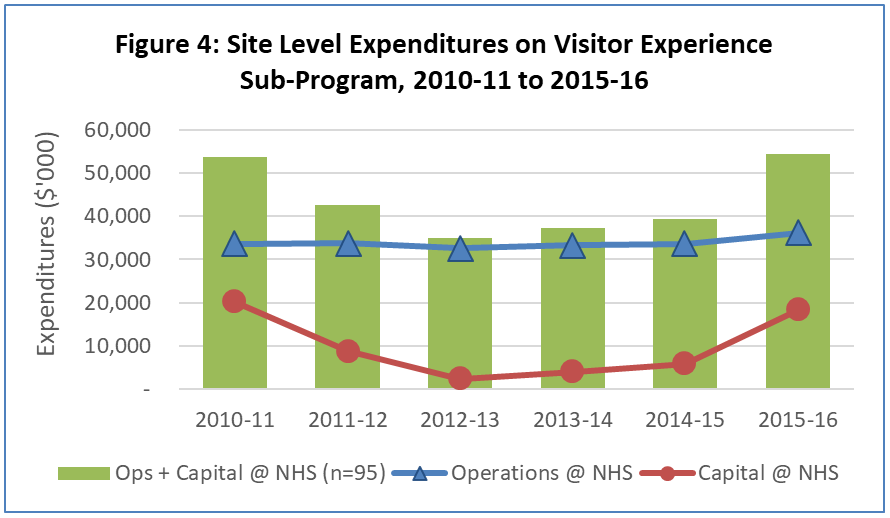
Source: Data provided by PCA Finance.
Text Version
| 2010-11 | 2011-12 | 2012-13 | 2013-14 | 2014-15 | 2015-16 | |
|---|---|---|---|---|---|---|
| Expenditures: | ||||||
| Ops +Captial @ NHS (n=95) | $53,698,128 | $42,630,572 | $34,959,500 | $37,233,077 | $39,253,301 | $54,366,072 |
| Operations @ NHS | $33,507,575 | $33,794,164 | $32,619,919 | $33,248,613 | $33,501,598 | $36,017,883 |
| Capital @ NHS | $20,190,553 | $8,836,408 | $2,339,581 | $3,984,464 | $5,751,703 | $18,348,189 |
- Operational expenditures remained relatively consistent (average of about $33.8 million per year) while capital expenditures varied significantly. The observed fluctuation in capital expenditures is aligned with various special purpose funds received for infrastructure investment and appears to account for most of variation in total expenditures.
- There is considerable variation in spending among individual national historic sites. On average, 10 of the 95 reporting units spent $1 million or more per year on the sub-program. Most units (76%) spent less than $500,000 per year; 35% spent less than $100,000 per year.
It is challenging to provide further details about trends in expenditures against activities given significant changes to Parks Canada's financial coding structure in 2014-15. However, as shown in Figure 5, data suggests that the majority of expenditures at the site-level were directed to activities related to either services and facilities (66%) or interpretive programs (25%). Expenditures related to visitor services and facilities appear to be growing as a portion of the total, likely due to increased capital spending noted above. A decrease in expenditures on interpretive programming likely reflects adjustments in coding rather than a real change in investment in this area.Footnote 40
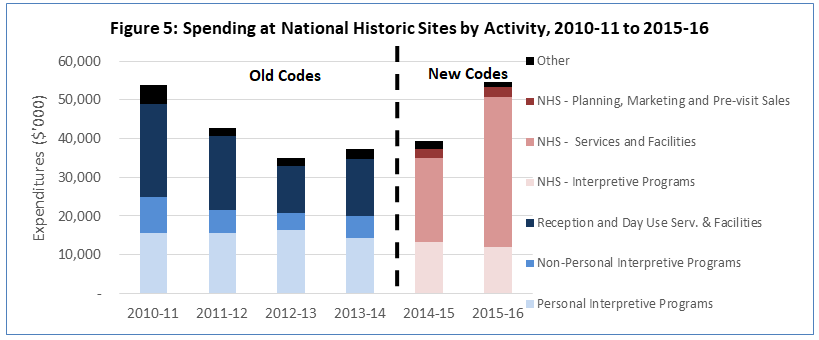
Source: Data provided by PCA Finance.
Text Version
| 2010-11 | 2011-12 | 2012-13 | 2013-14 | 2014-15 | 2015-16 | |
|---|---|---|---|---|---|---|
| Expenditures ($'000): | ||||||
| Other | $4,895,648 | $2,195,026 | $2,043,972 | $2,473,692 | $1,989,947 | $1,271,796 |
| NHS - Planning, Marketing & Pre-visit Sales | na | na | na | na | $2,373,098 | $2,605,463 |
| NHS - Services and Facilties | na | na | na | na | $21,733,257 | $38,597,640 |
| NHS - Interpretive Programs | na | na | na | na | $13,281,996 | $12,016,172 |
| Reception and Day Use Services and Facilities | $23,918,635 | $18,924,983 | $12,184,600 | $14,859,490 | na | na |
| Non-Personal Interpretive Programs | $9,310,844 | $5,978,581 | $4,380,224 | $5,736,894 | na | na |
| Personal Interpretive Programs | $15,714,474 | $15,681,141 | $16,389,765 | $14,213,002 | na | na |
Capacity of sub-program FTEs has decreased since 2012-13.
Parks Canada began reporting estimates of the human resources allocated to the sub-program in 2012-13. From 2012-13 to 2015-16, the Agency reported a 31% reduction in full-time equivalents (FTEs) supporting the sub-program (Table 8).
| Fiscal Year | 2012-13 | 2013-14 | 2014-15 | 2015-16 | % Change |
|---|---|---|---|---|---|
| Reported FTEs | 699 | 742 | 493 | 483 | -31% |
Source: PCA Departmental Performance Reports, 2012-13 to 2015-16.
This reduction is largely attributed to cost-saving measures introduced in 2012, including:
- Consolidation and streamlining of regional service centres into a decentralized National Office structure and a reduction in the conduct of some activities (e.g., social science), resulting in an estimated 44% reduction in visitor experience support staff.
- Changes in site-level operations such as shorter operating seasons and reduced operating hours at many national historic sites, and conversion of numerous sites to a self-guided model (n=32).
As discussed in section 4.2.3, this has created logistical issues for the design and delivery of the visitor experience at national historic sites. During site visits, both field staff and stakeholders referenced the increased role that external support has played in on-site delivery since 2012, both out of necessity and by choice. Unlike national parks or national marine conservation areas, some national historic sites rely entirely on external support for delivery of the visitor experience. In 2015, there were 26 national historic sites that recorded volunteer support in Parks Canada's volunteer database. This data indicates that:
- National historic sites collectively registered about 3,300 volunteers (approximately 64,000 hours).
- The number of volunteers engaged at any given site ranged from 4 to close to 800.
While these changes are generally seen as positive shifts in external relations, field staff also identified challenges with managing these relationships to ensure a quality visitor experience and the integrity of interpretive messages.
4.4 Performance: site-level outcomes and efficiency
In addition to understanding performance of the sub-program as a whole, Parks Canada seeks to understand the performance of individual national historic sites (i.e., how sites are performing relative to their expected results and perceived potential). Ultimately, an understanding of the factors that contribute to or impede site-level performance will help management improve performance across the system as a whole. In addressing this question, a number of challenges were encountered:
- There is a lack of consensus on what constitutes acceptable performance for any given site. We asked a few national or regional managers to identify examples of sites that they perceive to be performing well and under-performing. While all managers could make this kind of judgement, their selections were not always in agreement (i.e., some sites identified as performing well by one manager were identified by another manager as under-performing). This likely results from the different prioritization that each manager gives to varying aspects of performance. For example, one manager may focus on increases in the number of visitors, growth in revenue and type of audiences reached while another may focus on the number and nature of partnerships, community support and engagement, or the number and nature of new or innovative visitor experience programs.
- There is no clear framework for judging performance at the site-level. Corporate objectives for the visitor experience have been developed to assess average performance at the national, system or field unit level. While for many national historic sites data is available to indicate which sites are the most and least successful against these parameters (e.g., visitor satisfaction, enjoyment, learning and connection, increases in revenues and paid visits), it is not clear that corporate performance metrics are an appropriate basis for assessing performance at the site-level. Other direction (e.g., to retain and grow specific target audiences) lacks clear targets to determine acceptable levels of performance. As noted, efficiency metrics that could be used to differentiate sites' performance (e.g., cost per person-visit or per paid visit) were not in place at the time of the evaluation.
- Performance data is not available for all national historic sites. As noted, considerations such as the cost of data collection mean that the various types of data that could be used to evaluate individual performance and compare sites is not available for all locations. For example, while many national historic sites (n=76) have data on person-visits, fewer (n=53) have a Point-of-Sale System which would provide consistent details on revenue, paid visits, and a link to market analytic information, and fewer still (n=29) will have scientifically valid information on the relevant outcomes to be achieved (e.g., visitor satisfaction and enjoyment). It is not clear how to evaluate the relative performance of individual sites when comparable information is lacking.
- Performance metrics do not always tell a consistent story with respect to corporate direction. Figure 6 illustrates this issue using data showing the percentage change in person-visits versus paid visits at nine national historic sites from 2013-14 to 2015-2016. In each case, the direction of the observed trend differs between the two metrics. Similarly, some sites observed to be increasing visitation and revenue did not meet the corporate target for visitor connection and/or learning in their most recent visitor survey.
- Evaluations of relative performance are limited by contextual factors. Expanding on the examples in Figure 6, it may appear that Fort George National Historic Site is under-performing compared to Fort Malden National Historic Site given its relatively limited change in paid visits. However, this conclusion does not take into account the specific context of the two sites. Some of the variables impacting on performance (e.g., the size and type of offer, hours and season of operations, reliance on volunteers and other partners or community support) can be controlled or influenced by Parks Canada, while others cannot (e.g., a site's location, physical characteristics and historic character). Evaluations of relative performance must consider not just the direction of change but also what factors have contributed to or impeded this performance. For example, a site's location impacts on its proximity to target audiences and competing tourism offers; visitation at most sites is also subject to broader regional economic and tourism trends. Similarly, smaller sites are unable to host major events (e.g., concerts) that have contributed to significant increases in visitation at larger sites. Evaluations of relative success must also consider baseline levels of performance, i.e., sites that have already achieved a high level of performance may be more challenged to show further measurable increases.
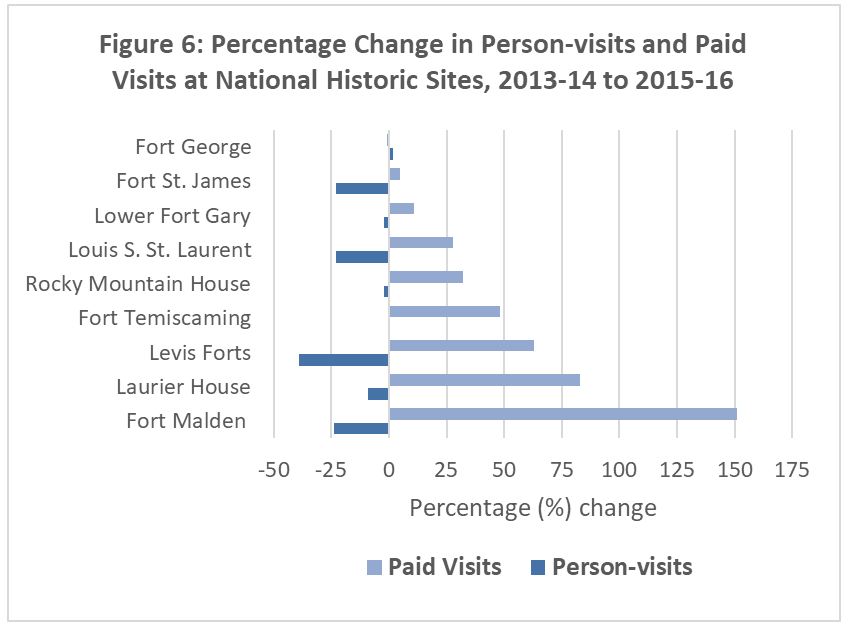
Text Version
| Fort Malden | Laurier House | Levis Forts | Fort Temiscamin | Rocky Mountain House | Louis St. Laurent | Lower Fort Gary | Fort St. James | Fort George | |
|---|---|---|---|---|---|---|---|---|---|
| Percentage Change 2013-14 to 2015-16 |
% | % | % | % | % | % | % | % | % |
| Paid Visits | 151 | 83 | 63 | 48 | 32 | 28 | 11 | 5 | -1 |
| Person-visits | -24 | -9 | -39 | 0 | -2 | -23 | -2 | -23 | 2 |
Evaluations of site-level performance are fundamentally multi-dimensional. In principle, these challenges could be avoided if each site were required to identify its individual performance targets, across a range of metrics, for a given period of time.
5. Conclusions, recommendations and management response
5.1 Conclusions
Relevance
Overall, the National Historic Site Visitor Experience Sub-program is relevant and consistent with the priorities, roles and responsibilities of both the Parks Canada Agency and the Government of Canada. The sub-program directly supports the Agency's mandate and vision by fostering opportunities for visitors to discover, experience, enjoy and develop a sense of personal connection to Parks Canada-administered national historic sites. The visitor experience is the primary means by which Parks Canada shares heritage messages in support of the commemorative integrity of these sites. It is through these learnings that Canadians have a better understanding of role and the significance of these sites in forming our shared history.
Performance
At a system-level, the Agency has met most of the expected results for the sub-program as identified in Agency's Performance Management Framework. In 2016–17, Parks Canada welcomed more than five million visitors to its national historic sites, the largest recorded level of visitation since 2010-11. This increased visitation was well above the national target of 2%. Though not perfectly correlated with visitation, revenues at national historic sites are also increasing. The Agency is also meeting and/or exceeding its targets for visitor satisfaction, enjoyment, and learning. However, there may be a need to improve results related to visitor connection at national historic sites.
Parks Canada's On Target Strategy (2011) identified the need to diversify and renew opportunities to attract and grow target audience segments. The strategy further specified a set of core and optional activities aligned with targeted audiences to be used in support of this renewal. The evaluation examined the extent to which this direction has contributed to the achievement of corporate results against the six activity areas of Parks Canada's national Visitor Experience Framework. The following summarizes key findings related to each activity:
- Identify target audiences: In recognition of the need to broaden the visitor base to include more non-traditional audiences, Parks Canada has identified and refined national target audiences.
- Do a diagnostic: Parks Canada has completed national reviews of the national historic site visitor experience in attempts to develop an integrated strategy to address key barriers to visitation. While most national historic sites have access to site-level data that could be used in conducting a local diagnostic, the majority of existing Visitor Experience Assessments pre-date the new direction introduced by the Agency in its On Target Strategy (2011). Since 2012, there have been few comprehensive diagnostics completed.
- Create and deliver visitor experiences: Parks Canada has used its management flexibilities to implement significant changes to the design and delivery of the sub-program at numerous national historic sites (e.g., move to a 'self-guided' delivery model, reductions in hours and season of operations). Our evaluation identified numerous examples of renewal of the visitor experience offer at national historic sites, including both the implementation of new national programs aimed at increasing visitation from target audiences and site-specific initiatives. However, many sites have a limited capacity to develop, deliver and review new programs, products and events.
- Promote: For people to choose a protected heritage place as their destination, Parks Canada also needs to inform potential visitors about the opportunities available at sites and entice them to plan their experience. The Agency has made strides in improving its website and broadening its exposure on social media platforms. However, staff are challenged to develop effective site-level campaigns given limited marketing resources. Many sites now leverage partners' resources to increase their reach, either through joint marketing efforts or partnered events.
- Measure and report: Parks Canada has implemented performance measurement programs to ensure the accountability and effectiveness of the sub-program; data collected is used to inform performance against the sub-program's corporate indicators. However, there is an unmet demand for more timely information focused on specific activities and programs at the local level and some confusion on when and how field level staff may collect additional information.
Under the Directive on Results, program management should develop and monitor valid and reliable information concerning the efficiency of its programs. However, as the period under evaluation pre-dated the Directive, expectations related to efficiency were limited to the tracking of financial and human resources assigned to this sub-program. This descriptive information was reviewed to note trends in the data, including the fact that spending increases can largely be attributed to increases in investment-related assets. This is largely the result of significant funding the Agency received under the Federal Infrastructure Investment Program to improve the condition of its entire built asset portfolio. Moving forward with the implementation of the Directive on Results, defining and monitoring efficiency at both the program and site levels represent significant future challenges for the Agency and will likely require a coordinated response by management, financial and performance and evaluation specialists over time.
The situation is similar with respect to judging the relative performance of individual national historic sites, as information for judging performance is not uniformly available at all sites and, when it is available, different metrics may provide different perspectives on site performance. Interpreting this variability and drawing conclusions about performance at the site level needs to take into account the operating circumstances of each place.
5.2 Recommendations and management response
| Recommendation 1: The Vice-President, External Relations and Visitor Experience, and Senior Vice-President, Operations, should develop a consistent approach to classifying national historic sites according to their level of visitor offer and identifying which sites must apply the visitor experience framework. | ||
|---|---|---|
| Context: The number of national historic sites with a visitor experience offer is not clearly defined. While the Agency's National Pricing Standard includes a definition of services and associated service levels, there are inconsistencies in these categorizations, such as some sites classified as Level 1 having an extensive visitor offer. In addition, Parks Canada uses other systems to define and classify the visitor offer at its national historic sites; however, while these systems overlap, they do not completely align. A clearly defined and consistently categorized visitor service offer would help to clarify expectations with regard to the application of the visitor experience framework (i.e., diagnostic analysis, identification of target markets, creating an offer, performance measurement). | ||
| Management response | Completion Date | |
| Agree: The Parks Canada National Pricing Standard includes a definition of services and rights and privileges that are commonly available in national historic sites. The standard classifies national historic sites into five different categories based on their service offer. This classification is clear as are associated service levels. When the service offer of a national historic site increases, the fees charged are adjusted. This is the case for the 17 national historic sites that are part of the new fees that will be implemented in January 2020. | January 2020 |
|
| Management Action Plan Deliverables | Responsible Party | Timeline |
| 1.1 Implementation of the five service offer categories at NHSs and adjustment to the fee structures, when required, to align with the implementation of the Service Fees Act. | Director, Visitor Experience | January 2020 |
| Recommendation 2: The Vice-President, External Relations and Visitor Experience, should develop a communications strategy to ensure a clear and consistent presentation of target audiences and how these are to be used in decision-making. | ||
|---|---|---|
| Context: The External Relations and Visitor Experience Directorate has developed and communicated guidance and tools supporting the application of the Agency's target audience approach although the specific audiences and related explanatory materials have changed over time. While visitor experience staff at national historic sites were aware of Parks Canada's national target audiences, many could not readily identify the specific audiences being targeted at their site, partly because of the changing nature of audiences and the focus on some audiences tied to particular initiatives. While it is reasonable for the Agency to change its focus to meet the needs of specific initiatives, related messaging and the continued availability of outdated materials has contributed to confusion with regards to the application of the target audience framework. | ||
| Management response | Completion Date | |
| Agree: The External Relations and Visitor Experience Directorate has updated its multi-year marketing and promotion strategy, "On Target" 2019-2022. The strategy's overall intention will remain to "seek and identify market segments with long term potential of growth" (with special consideration being given to new Canadians, young families, young adults, and school-aged children). The "On Target" strategy was updated in July 2019. | July 2019 | |
| Management Action Plan Deliverables | Responsible Party | Timeline |
| None required | ||
| Recommendation 3: The Vice-President, Indigenous Affairs and Cultural Heritage, in consultation with the Vice-President, External Relations and Visitor Experience, should review and update the performance measurement indicators related to visitor learning and understanding at national historic sites. | ||
|---|---|---|
| Context: The Agency continues to periodically complete formal assessments of the commemorative integrity of 73 national historic sites, including the "sharing of heritage value." However, only 29 of these sites have valid data for this performance measure. The updates to the National Historic Sites of Canada System Plan (now referred to as the Framework for History and Commemoration: National Historic Sites System Plan 2019) allow for an opportunity to review and update the current performance measurement indicators. | ||
| Management response | Completion Date | |
| Agree: Consistent with the Independent Working Group Report to the Minister of Environment and Climate Change Canada, the Indigenous Affairs and Cultural Heritage Directorate, in collaboration with the External Relations and Visitor Experience Directorate and Strategic Policy and Investment Directorate, will develop new performance measurement indicators to measure how visitors learn about the significance (commemorative integrity) of national historic sites. | March 2021 |
|
| Management Action Plan Deliverables | Responsible Party | Timeline |
| 3.1 Establish a working group consisting of Indigenous Affairs and Cultural Heritage, External Relations and Visitor Experience, Strategic Policy and Investment, Operations and the Indigenous Cultural Heritage Advisory Council to begin exploring meaningful indicators related to the effective communication of national historical significance and develop methodology to capture and analyse the data. | Director, Archaeology and History | March 2020 |
| 3.2 Work with Strategic Policy and Investment to integrate new performance measurement indicators as part of an updated Departmental Results Framework and/or Program Inventory. | Director, Archaeology and History | September 2020 |
Appendix A: Strategic outcome and program alignment architecture
The following figure presents Parks Canada's Program Alignment Architecture as it existed during the period under evaluation. The sub-program covered by this evaluation is highlighted in green. This structure was replaced with the Agency's new Departmental Results Framework in 2017.
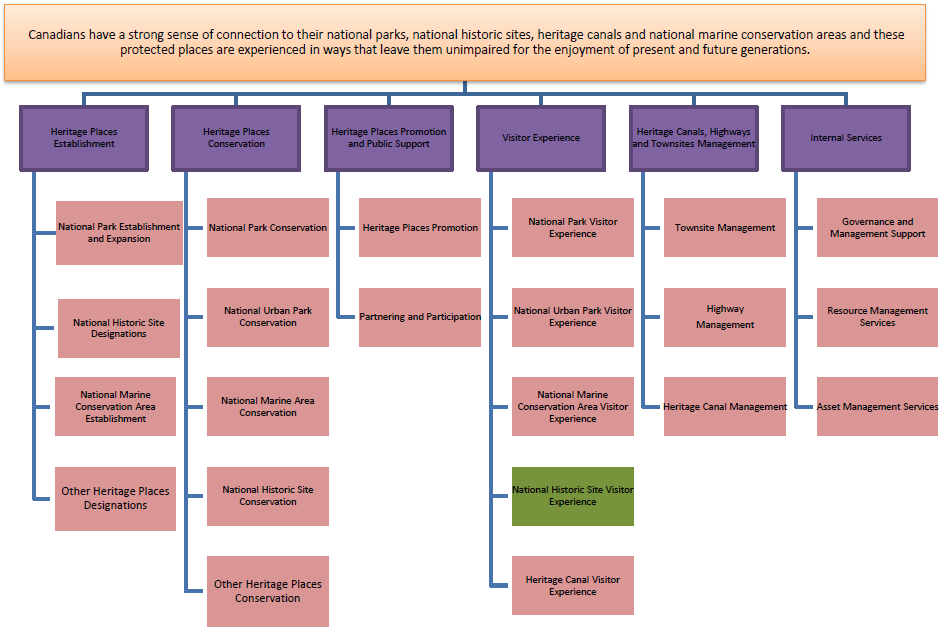
Text Version
Canadians have a strong sense of connection to their national parks, national historic sites, heritage canals and national marine conservation areas and these protected places are experienced in ways that leave them unimpaired for the enjoyment of present and future generations.
- Heritage Places Establishment
- National Park Establishment and Expansion
- National Historic Site Designations
- National Marine Conservation Area Establishment
- Other Heritage Places Designations
- Heritage Places Conservation
- National Park Conservation
- National Urban Park Conservation
- National Marine Area Conservation
- National Historic Site Conservation
- Other Heritage Places Conservation
- Heritage Places Promotion and Public Support
- Heritage Places Promotion
- Partnering and Participation
- Visitor Experience
- National Park Visitor Experience
- National Urban Park Visitor Experience
- National Marine Conservation Area Visitor Experience
- National Historic Site Visitor Experience
- Heritage Canal Visitor Experience
- Heritage Canals, Highways and Townsites Management
- Townsite Management
- Highway Management
- Heritage Canal Management
- Internal Services
- Governance and Management Support
- Resource Management Services
- Asset Management Services
Appendix B: Evaluation matrix and source definitions
| A. Relevance | ||||
|---|---|---|---|---|
| Core question | Specific questions | Expectations | Indicators | Data sources/ Methods |
|
|
|
|
|
|
|
|
|
|
|
|
|
|
|
| B. Performance | ||||
| Core question | Specific questions | Expectations | Indicators | Data sources/ Methods |
|
|
Where applicable given administrative structure of National Historic Sites:
|
|
|
|
|
|
|
|
|
|
|
|
|
|
|
|
|
|
|
|
|
|
|
|
|
|
|
|
| C. Efficiency and economy | ||||
| Core question | Specific questions | Expectations | Indicators | Data sources/ Methods |
|
|
|
|
|
Data sources and methods
- Document review. A wide range of documents was reviewed, including legislation, policies, corporate reports and program or project-specific documents such as agreements, strategies, guidelines, tools, research, and reported results.
- Database analysis. Analysis included a review of secondary data from the Agency's financial system (STAR), asset system (MAXIMO), and infrastructure project tracking system (MRT). Program-specific databases were also consulted (e.g., Attendance Reporting Information System, Visitor Information Program, the National Survey of Canadians, and Point-of Sale System).
- Key informant interviews. Key informant interviews were used to gather information across all the issues of the evaluation. Over 150 interviews were conducted with Agency personnel during site visits and at National Office. A limited number (n=18) of external stakeholders (e.g., "Friends of" Associations) were also interviewed. Where relevant, these interviews covered both the conservation and the visitor experience provided at national historic sites.
- Field Visits. Field visits were conducted to develop a more in depth understanding of how the sub-program operates at the field level, including the links between activities, outputs and results. In addition to the above mentioned interviews, site visits included a tour of the site to observe and discuss specific issues for visitor experience and recent or planned infrastructure projects.
Evaluation strengths, limitations and mitigation strategies
The evaluation's document review, site visits and interviews enabled a considerable understanding of the National Historic Site Visitor Experience Sub-program. Interviews with Parks Canada staff were sufficiently comprehensive to be considered representative of perceptions within the Agency.
Field work conducted in tandem with the concurrent Evaluation of National Historic Site Conservation Sub-program allowed for a more fulsome view of how these programs interconnect and provided a broader perspective on sub-program delivery. It also enabled the evaluations to maximize the breadth of site visits while minimizing costs to the Agency. Of the 45 sites visited, 16 were identified as a priority for the evaluation of National Historic Site Visitor Experience Sub-program. The remainder were either of primary interest to the Evaluation of National Historic Site Conservation and/or were conveniently co-located sites. The resulting number and diversity of sites visited by the evaluation team provided a good sample of the range in field-level capacity for, and delivery of, the various components of the visitor experience.
In conducting the evaluation, various issues with the availability, quality and consistency of data related to key metrics used for understanding performance and trends over time were noted (e.g., issues with attendance data, data on paid visits, information from the Agency's program of visitor surveys, asset data, and issues with continuity of financial data over time). These issues are noted as relevant throughout the report. There were additional challenges disaggregating data by national historic site as, depending on the specific data system, sites are inconsistently reported as individual sites or as part of a larger reporting unit (as a group of geographically co-located sites).
Data gaps or inconsistencies were mitigated to the extent possible by triangulation with other information sources, including cross-reference to market trends identified by Statistics Canada, Destination Canada and benchmark organizations. Interviews and document review related to site visits provided supplementary information on the visitor experience.
Appendix C: List of sites visited, by province/territory
| Location | Sites visited | Location | Sites visited |
|---|---|---|---|
| Yukon | Dawson Historical Complex Former Territorial Court House National Historic Site S.S. Keno National Historic Site Dredge No. 4 National Historic Site |
Quebec | Fortifications of Quebec National Historic Site: St-Louis Forts and Château National Historic Site Grosse Ile and Irish Memorial National Historic Site Sir George-Etienne Cartier National Historic Site Fort Chambly National Historic Site Coteau-du-Lac National Historic Site Forges du Saint-Maurice National Historic Site Louis-Joseph Papineau National Historic Site |
| British Columbia | Fort Rodd Hill National Historic Site Fisgard Lighthouse National Historic Site Fort Langley National Historic Site Gulf of Georgia Cannery National Historic Site |
Nova Scotia | Halifax Citadel National Historic Site York Redoubt National Historic Site Grand Pré National Historic Site Fortress of Louisbourg National Historic Site Alexander Graham Bell National Historic Site |
| Alberta | Cave and Basin National Historic Site Banff Park Museum National Historic Site Rocky Mountain House National Historic Site Bar U Ranch National Historic Site |
Prince Edward Island | Green Gables Heritage Place Port-La-Joye—Fort Amherst National Historic Site Ardgowan National Historic Site Province House National Historic Site Dalvay-by-the-Sea National Historic Site |
| Saskatchewan | Batoche National Historic Site Motherwell Homestead National Historic Site Battle of Tourond's Coulee/Fish Creek National Historic Site |
Newfoundland | L'Anse aux Meadow National Historic Site Signal Hill National Historic Site Cape Spear National Historic Site |
| Ontario | Fort Henry National Historic Site Fort Wellington National Historic Site Battle of the Windmill National Historic Site Bellevue House National Historic Site Laurier House National Historic Site Fort George National Historic Site Battlefield of Fort George National Historic Site Fort Mississauga National Historic Site HMCS Haida National Historic Site |
Manitoba | Lower Fort Garry National Historic Site The Forks National Historic Site |
Appendix D: Levels of service for National Historic Sites
| Service level | Definition of service level | Number of sites | Daily entry fee (Adult) |
|---|---|---|---|
| 1 | No basic heritage presentation or visitor services. | 95 | N/A |
| 2 | National historic sites with basic heritage presentation and visitor services that support visits of up to two hours. | 38 | $3.90 |
| 3 | National historic sites usually with multiple structures or extensive grounds that provide visitors with heritage experiences and learning opportunities through visits of roughly 2 to 4 hours. | 17 | $7.80 |
| 4 | National historic sites usually with multiple structures or extensive grounds that provide visitors with heritage experiences and learning opportunities through visits of roughly one-half day. | 3 | $11.70 |
| 5 | Large National historic sites with enhanced, day-long heritage presentation experiences through tours and animation, with extensive grounds and built heritage. | 2 | $17.60 |
Source: Parks Canada National Pricing Standard (2015)
Appendix E: Application of the visitor experience framework at National Historic Sites
For the purposes of this evaluation, the following are the 70 national historic sites we expected to have applied the Agency's visitor experience framework. This list includes all national historic sites included in the Attendance Program (assumed to be operational) with a stand-alone visitor service offer implemented by Parks Canada, in whole or in part. Our definition excludes sites that are operated fully by third parties (n=3) and those within a national park for which the site lacks a significant stand-alone offer (n=3).
British Columbia
1. Chilkoot Trail
2. Fort Langley
3. Fort Rodd Hill/Fisgard Lighthouse
4. Fort St. James
Alberta
5. Banff Park Museum
6. Bar U Ranch
7. Cave and Basin
8. Rocky Mountain House
Saskatchewan
9. Batoche
10. Fort Battleford
11. Fort Walsh
12. Motherwell Homestead
Manitoba
13. Lower Fort Garry
14. Prince of Wales Fort
15. The Forks
16. York Factory
Ontario
17. Bellevue House
18. Bethune Memorial House
19. Fort George
20. Fort Malden
21. Fort St. Joseph
22. Fort Wellington
23. HMCS Haida
24. Laurier House
25. Queenston Heights
26. Woodside
Quebec
27. Battle of the Châteauguay
28. Battle of the Restigouche
29. Cartier-Brébeuf
30. Coteau-du-Lac
31. Forges du Saint-Maurice
32. Fort Chambly
33. Fort Lennox
34. Fort Témiscaming
35. Fortifications of Québec
36. Saint-Louis Forts et Château
37. Grosse Île and the Irish Memorial
38. Lévis Forts
39. Louis S. St. Laurent
40. Manoir Papineau
41. Pointe-au-Père Lighthouse
42. Sir George-Étienne Cartier
43. Sir Wilfrid Laurier
44. The Fur Trade at Lachine
New Brunswick
45. Carleton Martello Tower
46. Fort Beauséjour - Fort Cumberland
47. Monument-Lefebvre
48. St. Andrews Blockhouse
Nova Scotia
49. Alexander Graham Bell
50. Canso Islands/Grassy Island Fort
51. Fort Anne
52. Fort Edward
53. Fortress of Louisbourg
54. Grand-Pré
55. Halifax Citadel
56. Marconi
57. Port-Royal
58. York Redoubt
Newfoundland and Labrador
59. Cape Spear
60. Castle Hill
61. Hawthorne Cottage
62. L'Anse aux Meadows
63. Port au Choix
64. Red Bay
65. Ryan Premises
66. Signal Hill
Prince Edward Island
67. Green Gables Heritage Place (L.M. Montgomery's Cavendish)
68. Skmaqn–Port-la-Joye–Fort Amherst
Yukon
69. S.S. Klondike
70. Klondike National Historic Sites
Appendix F. Parks Canada audience segments
The following table presents and describes Parks Canada's eleven audience segments. These can be divided between 'Younger Years', 'Family Years' and 'Mature Years'. The Agency's target audiences are highlighted in grey. Data is also provided on Parks Canada's target audiences by share of the Canadian population.
| Younger years | ||
|---|---|---|
| Single scene | Ethnically diverse singles and some couples under the age 34 living mainly in Quebec (47%) and Ontario (27%). Prefer concerts, sporting events over outdoor pursuits. | |
| Starter nesters | Segment is a younger, liberal group of ethnically diverse couples starting families, single parents and some singles. This group of individuals is looking for their place in the world and seeking status, which comes from material things and experiences. | |
| Family years | ||
| Young metro | Mix | In their late 30s with your children under 10 living in new suburbs in Alberta (43%) and Ontario (42%). Interested in activities they can do as a family. |
| South Asian | Segment is a younger, ethnically diverse group of couples and first and second generation immigrant families with young children. These family-filled households are found in ethnic enclave neighbourhoods in the big city and newer suburban areas in major cities in Canada. | |
| Fledgling families | Middle income family with children under 15, living in suburban areas in Quebec (38%) and Alberta (19%). Pursue active/outdoor lifestyles. Less interested in cultural activities. | |
| Family traditions | Late starters | Conservative, middle-aged and older couples with a mix of teens and primary-school kids, located in exurban and rural areas. However, this group includes a diverse segment who is making its way in adopting the "Canadian lifestyle", living in suburb communities. |
| Tween years | Conservative segment that consists of middle aged and younger couple with a mix of tweens and younger kids, located in exurban and rural areas. | |
| Middle age achievers | Naturals | Middle aged to older with teenagers and adult-age children who reside in wealthier urban to rural areas primarily in Ontario (50%). Enjoy outdoor and cultural activities. |
| Francophone families | Middle aged with teenagers who reside predominately in Quebec (93%). Pursue outdoor activities and are not interested in cultural or family oriented activities, apart from popular concerts. | |
| Team mates | Downscale singles and solo-parent families, living in mainly urban areas. Concentrated in dense and industrial tight-knit communities. Majority live in Ontario (52%). | |
| Diverse families | Younger and middle aged couples and families who settled in Canada before 2001. Mostly from southern Asia and Asia. Live in Ontario (38%), BC, (37%) and Alberta (21%) and primarily in Toronto (29%), Vancouver (32%) and Calgary (14%). | |
| Prosperous parents | Mainly older married couples with teenagers and adult-age children. Concentrated in affluent urban and suburban neighbourhoods. | |
| Maturing diversity | Middle-aged and older couples and families who settled in Canada over the last 4+ decades. With roots in Asia (e.g., China) and Europe (e.g., Portugal), this ethnically rich group has achieved middle class status in Canada through hard work and perseverance. | |
| Mature years | ||
| Country seniors | Empty-nest couples and retirees living predominately in rural communities and pursuing the quiet traditional country lifestyle. | |
| Emptying nests | Older couples and mature families with teenagers or adult children who are leaving home are transitioning to a new phase of life in their suburban communities. | |
| Later years | Older couples and adults (many widowed), whose children have mostly moved out, living in older neighbourhoods of Canada's major cities. | |
| Parks Canada target audiences by share of Canadian population | ||||||||||
|---|---|---|---|---|---|---|---|---|---|---|
| Region | Retain and grow | Nurture and grow | ||||||||
| Prosperous parents | Family traditions | Fledgling families | Middle aged achievers | Single scene | Young metro (Mix) |
Young metro (South Asian) |
||||
| Late starters | Tween years | Naturals | Francophone families | Sub-group total | ||||||
| Total | 100% | 100% | 100% | 100% | 100% | 100% | 100% | 100% | 100% | 100% |
| Atlantic | 3% | 4% | 21% | 8% | 9% | 5% | 7% | 2% | 5% | 0% |
| Quebec | 6% | 24% | 30% | 38% | 5% | 93% | 53% | 47% | 1% | 0% |
| Ontario | 57% | 44% | 26% | 13% | 50% | 2% | 24% | 27% | 42% | 63% |
| Manitoba/Saskatchewan | 7% | 6% | 5% | 12% | 9% | 0% | 4% | 3% | 5% | 0% |
| Alberta | 18% | 15% | 5% | 19% | 10% | 0% | 5% | 8% | 43% | 8% |
| British Columbia | 11% | 7% | 12% | 8% | 17% | 0% | 8% | 13% | 4% | 29% |
| North | 0% | 0% | 0% | 2% | 0% | 0% | 0% | 0% | 0% | 0% |
| Canada – PRIZM segment share | 7% | 9% | 8% | 7% | 5% | 6% | 11% | 10% | 3% | 2% |
Appendix G: Data collection instruments and data limitations
Data used to inform performance against Parks Canada's corporate indicators for the National Historic Site Visitor Experience Sub-program are primarily collected through three key social science instruments – the Attendance Program, Visitor Information Program and Point-of-Sale System.
Where and how each of these systems is implemented involves trade-offs between management information needs, the quality, consistency, and timeliness of the data and Agency's capacity to support various data requirements. It is not reasonable or expected that the resulting data would be free of all sources of potential error or imprecision or that all sites would collect the same data regardless of their individual circumstances. Senior management has recently reviewed issues with respect to various attendance measures in particular and endorsed the current approach.
Attendance Program
The attendance program is designed to track the number of person-visits to a site. A person-visit is counted each time a person enters part of a reporting unit for recreational, educational or cultural purposes during business hours (excluding through, local, and commercial traffic). Same-day re-entries and re-entries by visitors staying overnight in the reporting unit do not constitute new person-visits. Total person-visits include both Canadian and international visitors.
The Agency's approach to measurement of person-visits is based on guidelines prepared with support from Parks Canada for the World Conservation Union (IUCN).Footnote 41 Reports of person-visits may be a precise count (i.e., where there is only one controlled point of access and purpose of the visit is easily determined) or an estimate of number of visits (when there are many uncontrolled points of access and/or where visitors are not easily distinguished from non-visitors). Estimates of person-visits can be based on a wide variety of data sources (e.g., traffic or pedestrian counters, point of sale transaction, third party data, manual counts or observation, and use of permits) and the use of various formula to adjust the basic data. The exact methods used vary to accommodate the specific situation of each site managed by the Agency.
We found that in 2016-17, there were 76 national historic sites that reported attendance data.Footnote 42Most of these national historic sites have controlled points of access and therefore attendance reports at these locations likely provide reasonable approximations of the actual number of person-visits. However, some sites with an important number of visitors do estimate the number of person-visits based on attendance formulas and are therefore subject to some potential error.Footnote 43 This includes the Fortifications of Quebec National Historic Site, which in 2016-17 accounted for an estimated 2.2 million person-visits (i.e., 40% of total person-visits to national historic sites). While the Agency has previously classified the methodology used to calculate person-visits at each site as having a low, medium or high confidence level (i.e., how much confidence should be placed in the estimate, we did not obtain information on whether this classification scheme is still in use and if so how it applies to specific national historic sites.
Estimation methods at particular sites are sometimes updated to ensure they respond to potential changes in patterns of use and/or to improve confidence in the estimate. There is no standard in the Agency for when this should be done. The Agency's resources for reviewing and updating attendance methodology at specific sites were significantly reduced as a result of the deficit reduction action program in 2012. Currently, a decision on whether and when to update the methodology is largely left to local management. Over the evaluation period, eight national historic sites updated their attendance methodology.
Finally, it should be noted that person-visits are reported as precise numbers at all sites regardless of whether the number is based on a count or an estimate. While there will be some unquantified error given locations where estimates are used, estimates of person-visits at the sub-program level likely do provide reasonable orders of magnitude of trends in visits.
RMS Point-of-Sale (POS) System
Implementation of the RMS Point of Sale System began in 2013-14 and was rolled-out in stages. It is currently used in 53 national historic sites. These sites include most of the national historic site locations where Parks Canada collects revenues.Footnote 44 Parks Canada uses a RMS Point of Sale System to collect information on paid visits and associated revenue. In principle, a paid visit is recorded for every paid entry into a Parks Canada location.Footnote 45 The system is also used to collect information from a sample of paying visitors (depending on the site, up to 100%). This includes data on the size of the party (broken down for the number of adults/seniors/youth/children); service language; visit characteristics (e.g., length of stay, visit frequency); country of visitor origin; and Canadian postal codes or American zip codes. These postal codes provide the key piece of information needed to link paying visitors to audience segments. It is standard practice to collect postal code information from only one member of the visitor party.
There are some limitations in the data produced by the system resulting from how it is set up at particular locations. For example, the count of paid visits may exclude entries that by-pass the system, such as entry based on park passes or where fees are collected manually or via a third party. Data on paid visits from entry by commercial groups is also inconsistently recorded from site-to-site. Parks Canada's Audit of the Point-of-Sale System (2016) contains more related analysis.
To the extent some paying visitors can by-pass the system, the resulting profile of visitors and their characteristics may be biased. Other practices that may produce an unrepresentative profile of paying visitors include not following the prescribed sampling procedures, where relevant. We did not obtain information on the extent to which these issues would be pertain to particular national historic sites.
Information collected through POS is intended to be representative of paying visitors and not necessarily representative of all visitors to a site (i.e., person-visits). The extent of the gap between the two populations varies from site to site. For the 47 national historic sites that collected both person-visit and paid visit data in 2015-2016, paid visits represented on average 68% of the person-visits (range 15% to 99%).Footnote 46 At over half of these site (57%), paid visits represented 75% or more of the person-visits.
Consumers of the target audience information should also understand that the audience segments themselves are statistical entities and not precise, homogenous categorizations of people. This is demonstrated when postal codes are used to determine whether a person or a party of people belongs to a particular audience segment. Logically, not every person or household within a given postal code will be identical in life stage or other characteristics.
While variability within a given audience segment is common, it is not always evident in how these are presented. For example, the target audience segment labeled "single scene" which is characterized in part as a "diverse group of singles and some couples under the age 34" actually includes a majority of households where the head of the household is over the age of 35 and is married. In other words, households within this segment are not synonymous with categories such as "young" or "single".
This is not to say that the audience segments are not useful purposes of planning, marketing and promotion. Rather, it is a caution to consumer of the information that audience segments are statistical constructs that should be used with the appropriate understanding of their strengths and limitations.
Visitor Information Program
The Visitor Information Program (VIP) involves on-site surveys of visitors during the May 1st to September 30th period. The program is planned, managed, and administered by Parks Canada's Social Science Branch. The survey methodology is based on asking visitors on-site to participate in a survey. As such the results are more likely, in some cases, to be more representative of visitors (i.e., person visits) than similar information from the RMS POS System.Footnote 47 However, for sites with a longer operational season, there could be significant differences in the type of visitor beyond the May to September data collection period that are not captured by the survey.
Visitors surveys are used to collect information to create a profile of on-site visitors, such as their demographic characteristics (e.g., age, origin, group size), visit characteristics (e.g., length of stay, visit frequency), and as well as outcome measures related to their satisfaction, learning and meaningfulness of their experience.
In 2013, Parks Canada provided new direction for the Visitor Information Program to better align it with organizational changes, significantly reduced resources for social science in the Agency and revised legal obligations related to management planning and reporting. Major changes resulting from this new direction included:
- Division of the survey into two components – the 'VIP Core' and the 'VIP Lite'. The 'VIP Lite' is a streamlined version of the core survey. While both versions include standard national content, only the 'VIP Core' includes additional space for site-specific content. In addition, while the core survey continues to be administered by surveyors using random selection of visitors, the 'VIP Lite' is now informally administered by staff based on visitor self-selection. In principle, the 'VIP Core' should continue to produce data that is rigorous, defensible, and representative of the population of visitors in a given period. The data from the 'VIP Lite' is not intended to be scientifically defensible and the Social Science Branch has clearly indicated that it should only be used as general directional information.
- Reduction in survey coverage and frequency. Under the revised program, the total number of national historic sites required to conduct a VIP was reduced to from 72 to 61 (a 15% reduction). The Agency now requires 29 sites to conduct a 'VIP Core' every five years, and 32 sites to conduct a 'VIP Lite' every ten years. An additional 12 sites may complete an optional 'VIP Lite'.
From 2014 to 2016, there were 18 national historic sites scheduled to conduct a core survey. Two of these sites did not complete the survey process. In addition, results for three sites did not meet program standards for sample size/margin of error. These results are not published or combined with the national report. The schedule was also disrupted by a decision not to conduct the Visitor Information Program in 2017. The four national historic sites affected will need to have their survey rescheduled.
- Date modified :